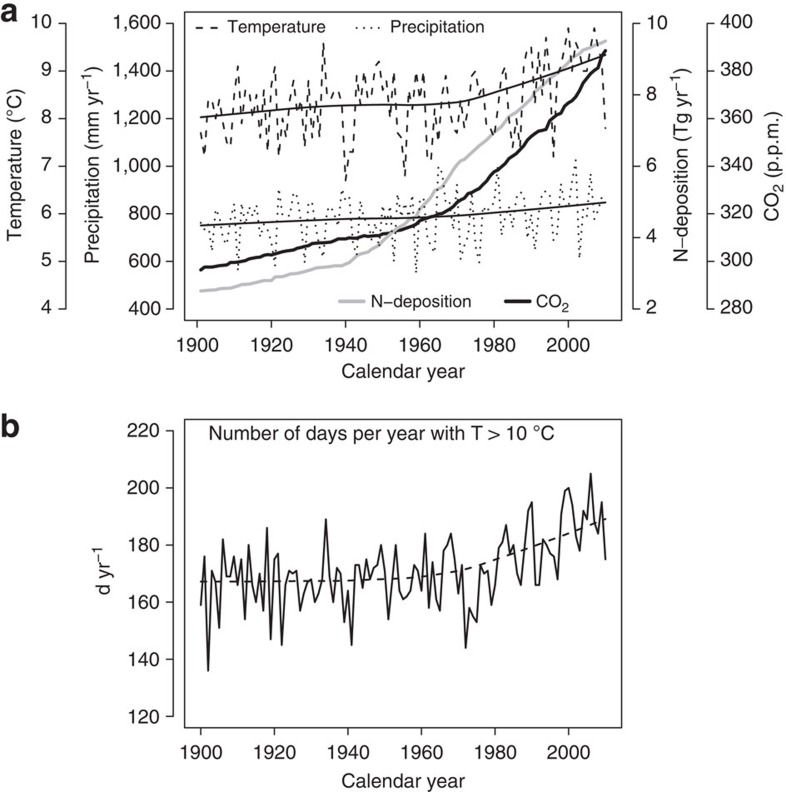
Figure 2. Change in growth conditions for Central Europe since 1900.
(a) Trend in mean annual air temperature (dashed), annual precipitation (dotted), atmospheric CO2-concentration (bold black line) and N-deposition (bold grey). For better trend visualization loess smoothers for temperature and precipitation have been added (thin solid lines). (b) Extended annual growing season, expressed by the number of days per year with a mean temperature >10 °C (solid). The dashed line represents a loess smoother. Data sources: Churkina et al.6, Schönwiese et al.10

