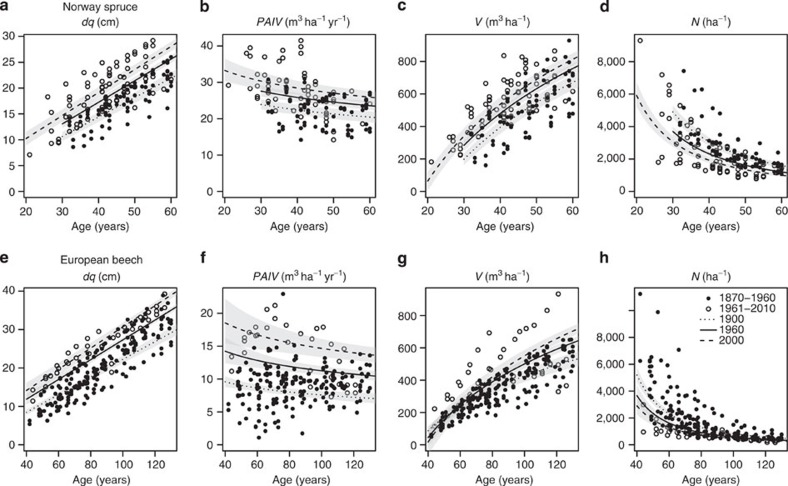
Figure 3. Statistical analysis of tree and stand dynamic changes since 1870.
Trends in (a,e) mean stem diameter dq; (b,f) stand periodic annual volume increment (PAIV); (c,g) standing volume V and (d,h) tree number N; for Norway spruce (a–d) and European beech (e–h) age ranges. Observations before 1960 (filled symbols); after 1960 (empty symbols); predictions with our fitted linear mixed models (LMM) for 2000 (dashed line); for 1960 (solid line) and as a reference for 1900 (dotted line). The grey-shaded areas illustrate the prediction standard error. Although the error bands partly overlap, all illustrated calendar year trends were significant at P<0.05 (LMM), with n=157 (a,c,d); n=141 (b); n=225 (e,g,h) and n=217 (f). Note that positions on the error bands were not independent, for example, a prediction on the lower edge of the confidence band for one calendar year would be on the lower edge for all other calendar years.

