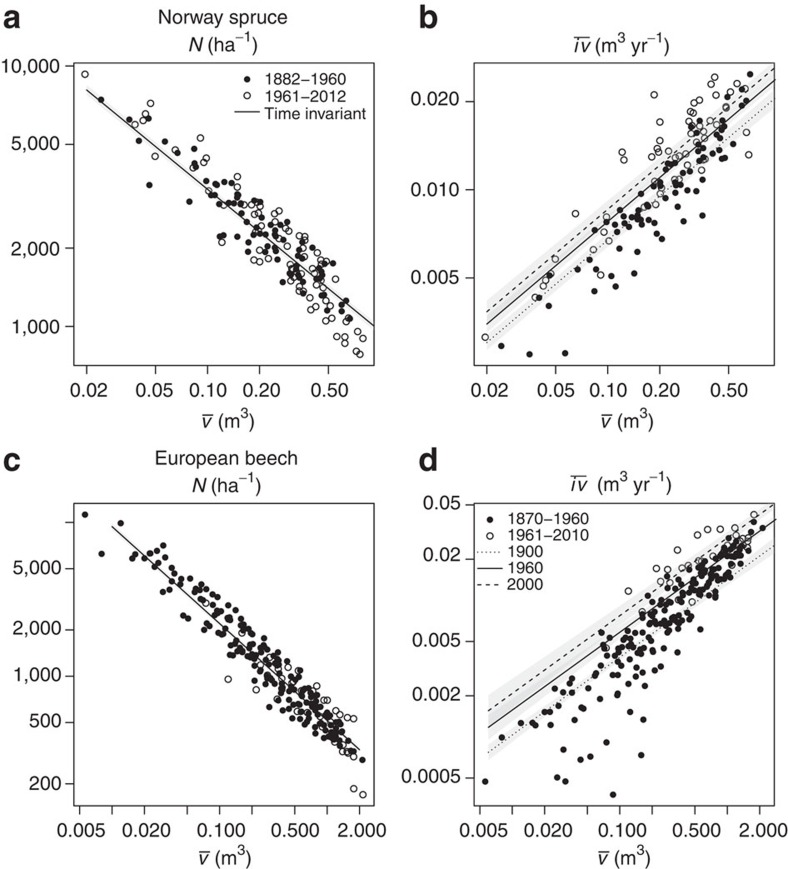
Figure 5. Stand allometry in past and present for Norway spruce and European beech.
Relationships between (a,c) tree number N and mean tree volume  ; and (b,d) mean annual volume growth
  and mean tree volume
  in a double-logarithmic scale for Norway spruce (a,b) and European beech (c,d). Filled symbols: observations up to 1960; empty symbols: after 1960. Predictions derived from our fitted linear mixed models (LMMs) do not change with calendar year for the
  relationship (solid lines in a,c), whereas they do for the
  relationship. We show the predictions for the years 2000 (dashed lines in b,d), 1960 (solid lines in b,d) and the 1900 reference (dotted lines in b,d). The grey-shaded areas illustrate the prediction standard error. Although the error bands partially overlap, all illustrated calendar year trends were significant at P<0.01 (LMM, n=141 and n=217 for Norway spruce and European beech). Note that positions on these error bands are not independent, for example, a prediction on the lower edge of the confidence band for one calendar year would be on the lower edge for all other calendar years.

