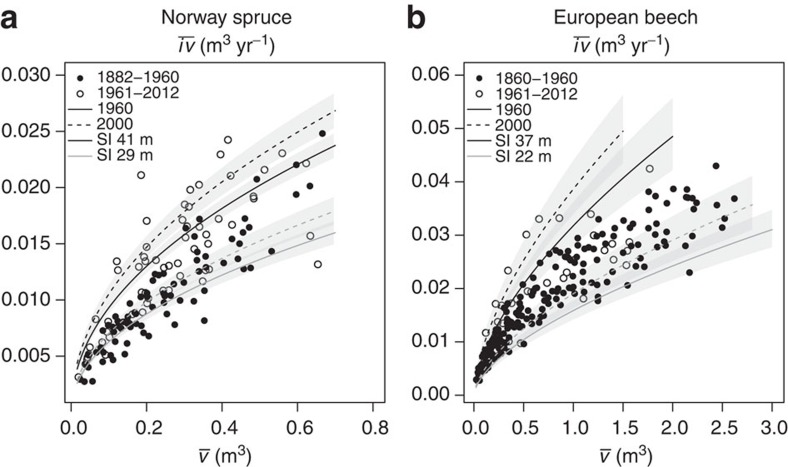
Figure 6. Site-dependent allometry change.
The  relationship’s change (
 : mean annual volume growth;
  : mean tree volume) depended on site quality as expressed by the site index (SI) for Norway spruce (a) and European beech (b). SI is the yield-table expectation for stand height at 100 years of age. Filled symbols: observations up to 1960; empty symbols: after 1960. Dashed lines represent the estimated curves obtained from fitted linear mixed models (LMM) for the calendar year 2000; solid lines for 1960. Light grey and black lines: curves for the lowest and highest SI represented by our data, respectively. The grey-shaded areas illustrate the prediction standard error. Although the error bands partly overlap, the illustrated interactions of calendar year and site quality were significant at P<0.01 (LMM, n=141 and n=217 for Norway spruce and European beech). Note that positions on these error bands were not independent, for example, a prediction on the lower edge of the confidence band for a given calendar year and a given site quality would be on the lower edge for all other calendar years and SI’s.

