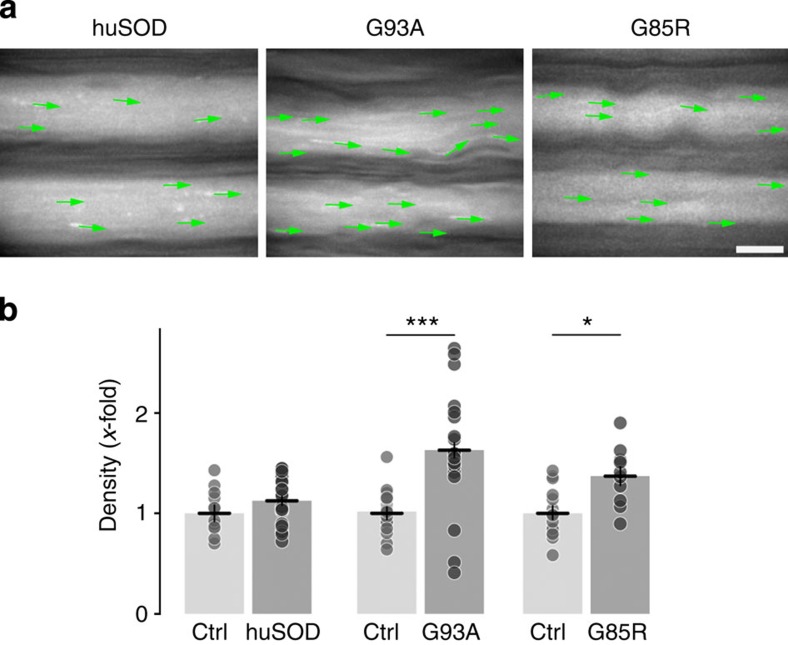
Figure 5. Microtubule dynamics in neurodegenerative disease.
(a,b) Microtubule dynamics are altered with increased comet densities in two models of familial ALS, but not in control mice that overexpress a non-mutated form of human SOD1 (Ctrl: respective wild-type litter mates as controls; ‘huSOD’, non-mutated form of SOD1, P120; ‘G93A’: SOD1G93A mutation, P120; ‘G85R’, SOD1G85R mutation, preterminal; n≥10 neurites from ≥2 mice for each group; data symbols indicate mean±s.e.m.). Scale bar in (a) 5 μm. ***P<0.001; *P<0.05, analysis of variance.

