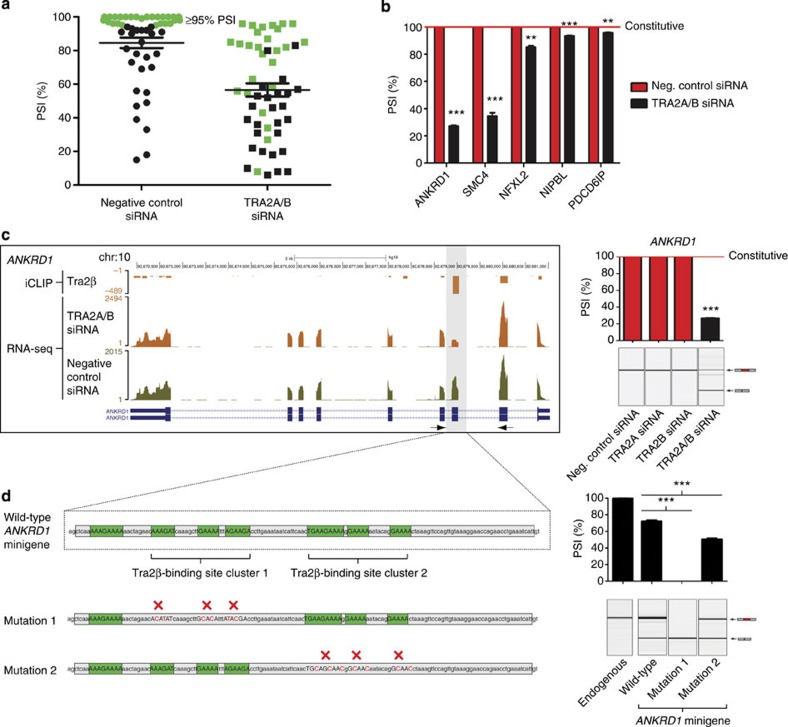
Figure 3. Tra2 proteins control splicing of constitutively spliced target exons.
(a) Many novel Tra2α/β-responsive exons normally have high levels of splicing inclusion in MDA-MB-231 cells. PSI levels of target exons are shown from negative control siRNA-treated cells and after joint Tra2 protein depletion. Exons included at equal to or greater than 95% PSI in control MDA-MB-231 cells are highlighted in green. (b) The inclusion of five constitutively spliced Tra2β target exons is reduced after joint Tra2α/Tra2β protein depletion. PSI levels were measured by RT–PCR and capillary gel electrophoresis. (c) The splicing profile of the ANKRD1 gene changes in response to joint depletion of Tra2 proteins. Combined iCLIP and RNA-seq data were visualized on the UCSC genome browser35 (left panel), and splicing inclusion levels directly measured using RT–PCR (right panel). Probability (P) values were calculated using an independent two-sample t-test between the PSI levels of negative control siRNA-treated cells and the gene-specific siRNA-treated cells (statistical significance: *P<0.05, **P<0.01, ***P<0.0001). All data represented by bar charts was generated from three biological replicates and error bars represent s.e.m. (d) Tra2β binding sites in the ANKRD1 exon are essential for its splicing inclusion. The wild-type minigene contained two clusters of Tra2β binding sites, which were independently altered by mutagenesis (left panel). The PSI of the resulting exons was measured after transfection into HEK-293 cells at endogenous Tra2β protein concentrations (right panel). Probability (P) values were calculated using an independent two-sample t-test between PSI levels of the wild-type and mutated versions of the ANKRD1 minigene (statistical significance: *P<0.05, **P<0.01, ***P<0.0001). All data represented by bar charts was generated from three biological replicates and error bars represent the s.e.m.

