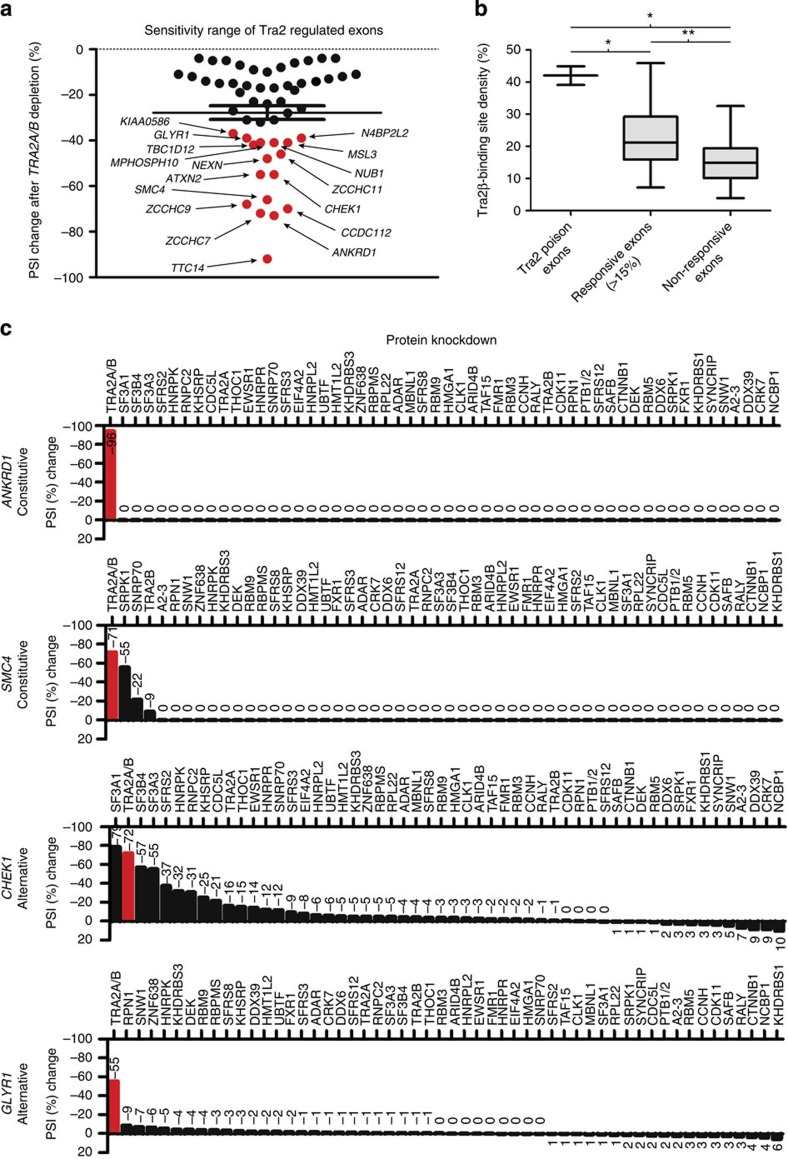
Figure 4. Identification of exons jointly controlled by Tra2α and Tra2β proteins.
(a) Scatterplot showing amplitude of splicing response of 53 exons to joint depletion of endogenous Tra2α and Tra2β in MDA-MB-231 cells. The genes corresponding to the highest amplitude PSI changes after joint Tra2 protein depletion are labelled and highlighted in red. (b) Analysis of Tra2β binding site density (measured as a percentage of exon content) within groups of Tra2β target exons identified by iCLIP. Tra2β binding site density comparisons are shown between the Tra2α and Tra2β poison exons; all exons that showed a greater than 15% point PSI change following joint Tra2α and Tra2β depletion; and in the exons that bound Tra2β based on iCLIP tag coverage but did not respond to Tra2α and Tra2β depletion. Probability (P) values were calculated using an independent two-sample t-test (statistical significance: *P<0.05, **P<0.01, ***P<0.0001). (c) Regulation of ANKRD1, SMC4, GLYR1 and CHEK1 splice variants following knockdown of a panel of RNA binding proteins (RBPs) in MDA-MB-231 cells5. The y axis shows PSI change after joint Tra2α and Tra2β depletion, with a negative number indicating splicing repression in the absence of these proteins.

