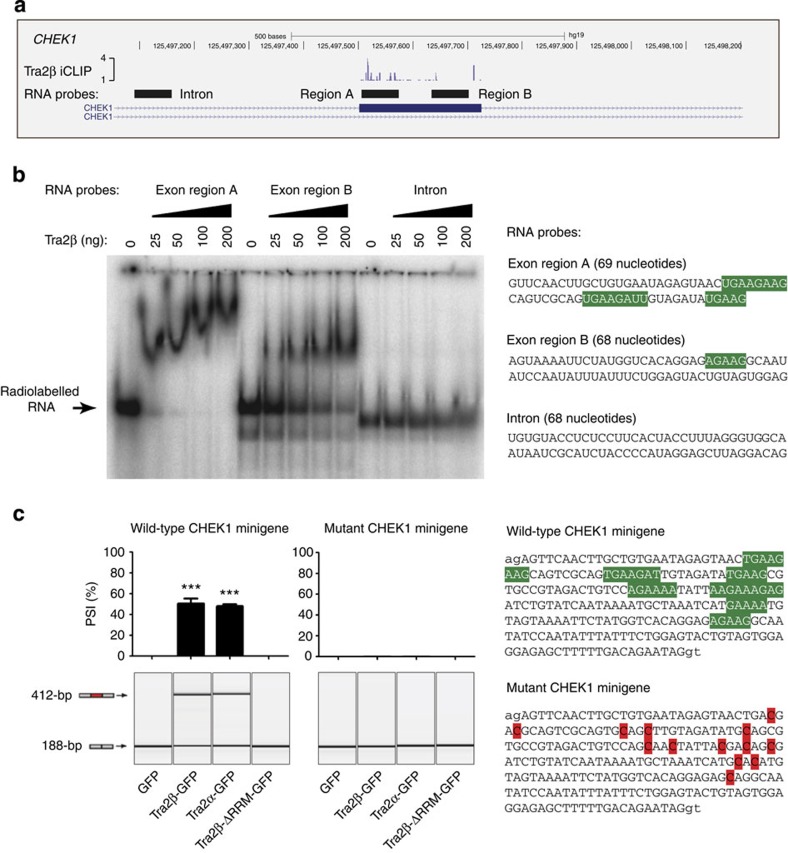
Figure 7. Human Tra2α and Tra2β regulate CHEK1 exon 3 through direct RNA protein interactions.
(a) High resolution map CHEK1 exon 3 showing mapped iCLIP tags (purple bars) and the three subregions of the pre-mRNA, which were used to generate RNA probes for EMSAs. This screenshot was downloaded from the UCSC genome browser35. (b) Molecular interactions between purified Tra2β protein and RNA probes in and around CHEK1 exon 3 (the location of these probes is shown in part a). The sequences of the probes are shown to the right, with predicted Tra2β binding sites shaded green. (c) Splicing patterns of mRNAs made from a minigene containing CHEK1 exon 3 in response to coexpressed fusion proteins, expressed either as a PSI (upper bar chart, n=3 independent experiments) or shown as one of the original capillary electrophoresis gel-like images from a single experiment (lower image). The sequence of CHEK1 exon 3 is shown to the right, with the predicted Tra2β binding sites shaded green (above) and the altered sequence after these sites were mutated (below, the altered nucleotides are shaded red). Probability (P) values were calculated using an independent two-sample t-test between PSI levels of the minigene-derived CHEK1 exon 3 in cells cotransfected with GFP and each of the different Tra2 constructs (statistical significance: *P<0.05, **P<0.01, ***P<0.0001). All data represented by bar charts was generated from three biological replicates and error bars represent s.e.m.

