Figure 3.

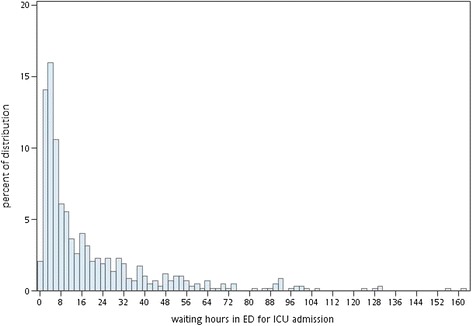
Distribution of deaths by ICU waiting hours at the ED. Percentage = (number of deaths in 21 ventilator days in the group with the designated ICU waiting hours)/(number of all deaths in 21 ventilator days).

Distribution of deaths by ICU waiting hours at the ED. Percentage = (number of deaths in 21 ventilator days in the group with the designated ICU waiting hours)/(number of all deaths in 21 ventilator days).