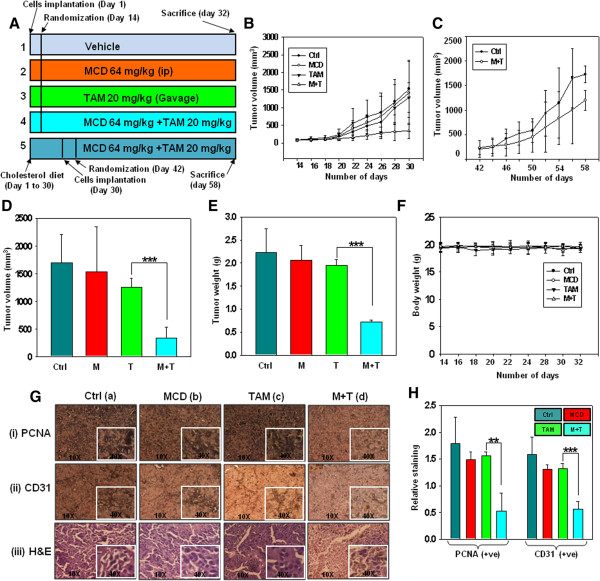
Figure 4.

Effect of tamoxifen and MCD on isografted mouse tumor model. Mice were pre administered with 64 mg/kg of MCD (oral/alternative day) and 20 mg/kg of tamoxifen (i. p./alternative day). Control mice were administered with equal volume of normal saline on the same treatment day. (A) Experimental layout of in vivo study. (B) Tumor initiation and progression after drug administration in control and treated mice. (C) Changes in tumor volume in cholesterol supplemented mice after drug administration. (D and E) Bar graph (Mean ± SD) showing average tumor volume and tumor weight respectively of mice fed with normal diet, on the day of sacrifice (day 32). (F) Changes in body weight in mice during the course of treatments. (G) Representative panel of immunohistochemistry analysis of (i) PCNA, (ii) CD31 in the tumors of mice administered with MCD, tamoxifen and MCD along with tamoxifen. Magnification (10×) with inset at (40×).(iii) H&E staining of tumor of untreated and treated mice developed with DAB (brown) and counterstained with hematoxylin nuclei (blue). (H) Bar graph (Mean ± SD) showing quantitation of average number of PCNA positive cells selected from multiple fields by Image J software. (*P ≤ 0.05, **P ≤ 0.001, ***P ≤ 0.0001).
