
Figure 4.
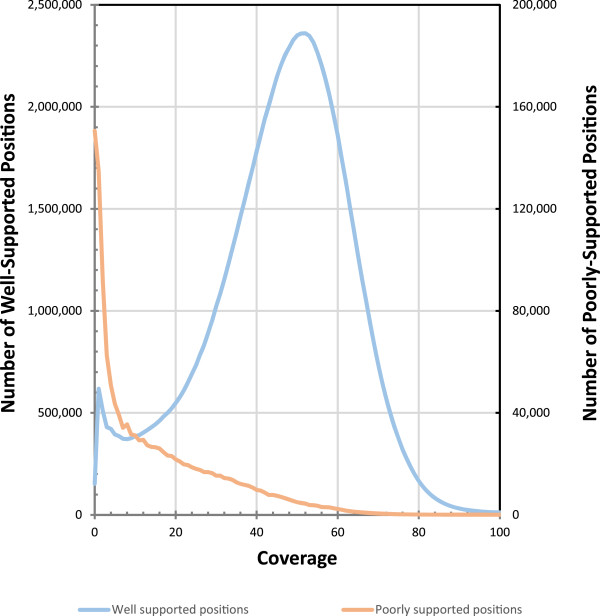
Sequencing coverage distribution of high and low coverage areas. Histograms of the coverage at each position following mapping of the Illumina MiSeq reads to the Quiver-trimmed HGAP2 assembly are plotted for those positions that Quiver identifies as well-supported and those that are poorly-supported. Many of the remaining poorly supported internal positions have low coverage.