
Figure 5.
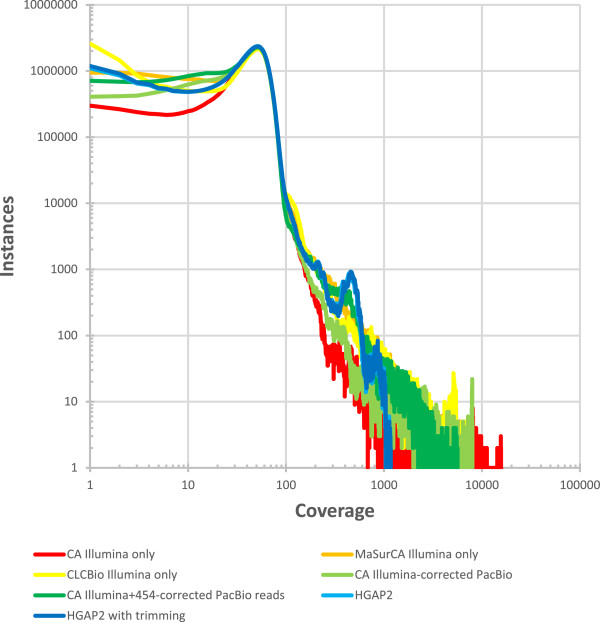
Sequencing coverage distribution. A histogram of the coverage at each position following mapping of the Illumina MiSeq reads to all assemblies are plotted with log-transformed axes. Regions with abnormally little coverage exist, as well as those with excess coverage, for all assemblies. The peak in coverage for the Illumina data was at 51× coverage. In addition to this major peak, two additional peaks were identified at 200× and 450× in the HGAP2 assembly, reflecting collapsed repeats in the assembly including the mitochondrial genome, a L. loa interspersed repeat, and the rRNA.