
Figure 7.
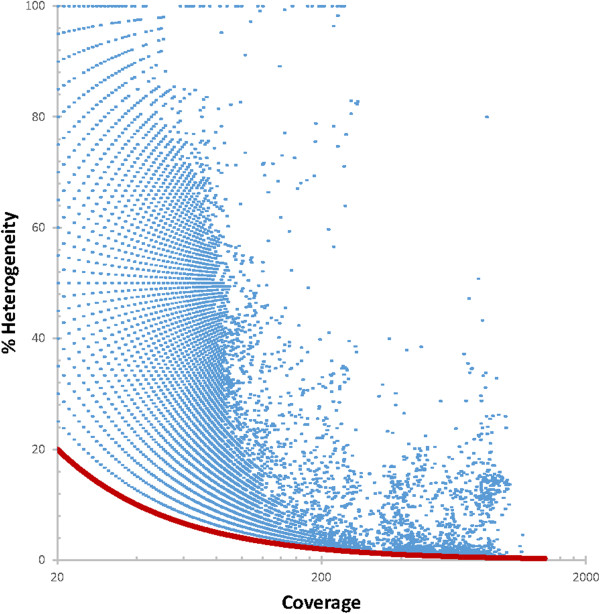
Relationship between coverage and percent heterogeneity. A SNP was defined as a position with >20× coverage that had polymorphisms supported by >3 reads. For each position with a SNP, the percent heterogeneity and coverage are plotted. The red line shows the minimum bounds of the data that is defined by requiring >20× coverage and polymorphisms in three reads. As expected, some of the 100% heterogenous positions have higher coverage than average suggesting that they may be collapsed repeats. This plot does not enable any conclusions about the frequency at which a value occurs since data points with the same values are only plotted once.