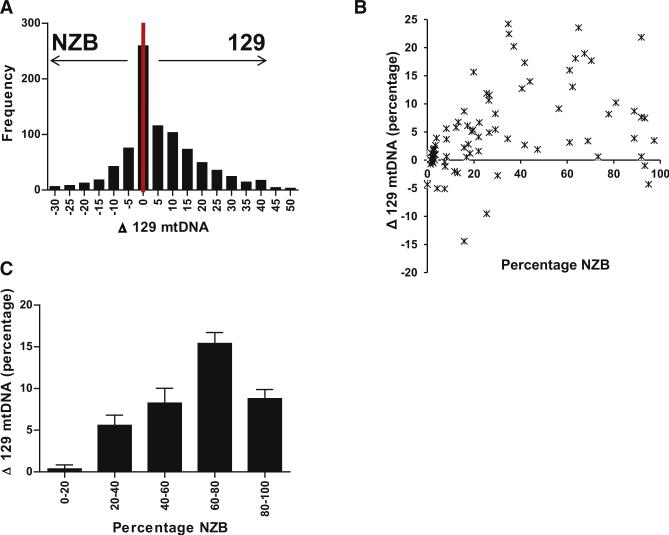
Figure 1. Change in Progeny 129-NZB mtDNA Heteroplasmy in Offspring from Mothers with Varying Levels of Tail Heteroplasmy.
(A) Frequency histogram of the segregation of mtDNA variants in the germline (n = 864). (B) The average change in 129-NZB mtDNA heteroplasmy of all the progeny of a particular female (n = 78) relative to her tail heteroplasmy. (C) The average change in 129-NZB mtDNA heteroplasmy in pups of females grouped according to their proportions of the different mtDNA variants, 0%–20% group, n = 341; 20%–40%, group n = 140; 40%–60% group, n = 84; 60%–80% group, n = 168; and 80%–100% group, n = 158. The proportion of NZB mtDNA in the tail of a pup was subtracted from the proportion of NZB in the tail of the mother (both at P10). Positive values represent segregation toward 129 mtDNA and negative values toward NZB mtDNA. Error bars represent ± SEM. See also Figure S6 and Table S1.

