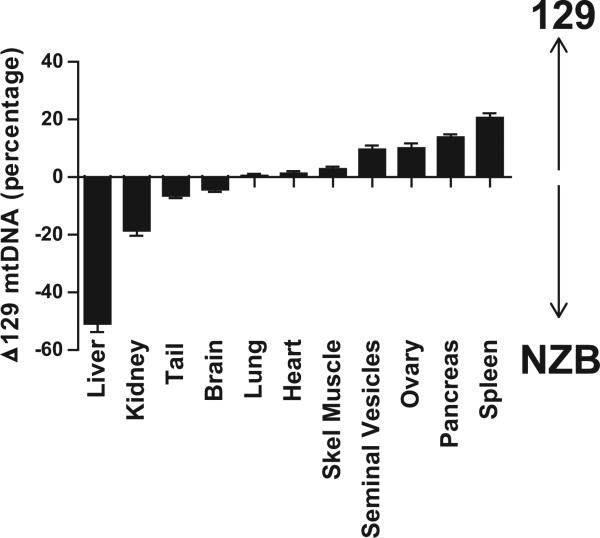
Figure 2. Change in mtDNA Heteroplasmy in Organs of Adult Mice Compared to P10 Tail Tip Heteroplasmy, Determined by Fragment Analysis.
Positive values represent increased 129 mtDNA content negative values increased NZB mtDNA. More than 50 mice were examined for each tissue except for the ovaries (n = 26), and seminal vesicles (n = 21). Error bars represent ± SEM. See also Figure S1.

