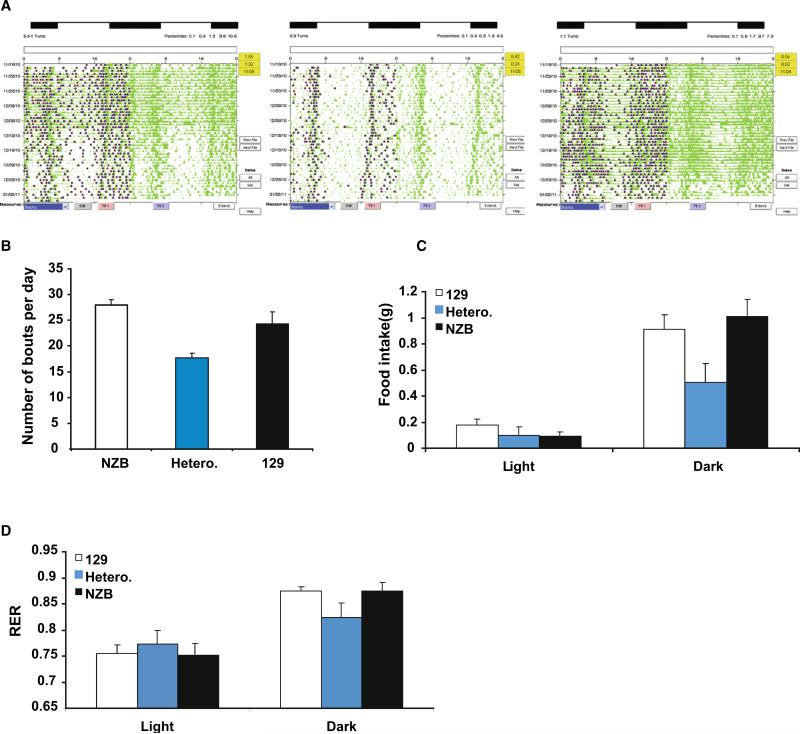
Figure 5. Behavior and Metabolism of Heteroplasmic Mice and Their Homoplasmic Segregants during the Circadian Cycle.
(A) Quantification of activity bouts in light and dark cycles. Left panel: homoplasmic 129 mtDNA animals. Middle panel: heteroplasmic NZB-129 animals. Right panel: homoplasmic NZB mtDNA animals. (B) Average activity bouts during the continuous dark period of the three mtDNA genotype animals. (C) Average food intake of the mice with the three mtDNA genotypes in the dark and light periods. (D) Average differences in respiratory exchange ratio (RER) during the light and dark period of the heteroplasmic and homoplasmic mice. Error bars represent ± SEM.

