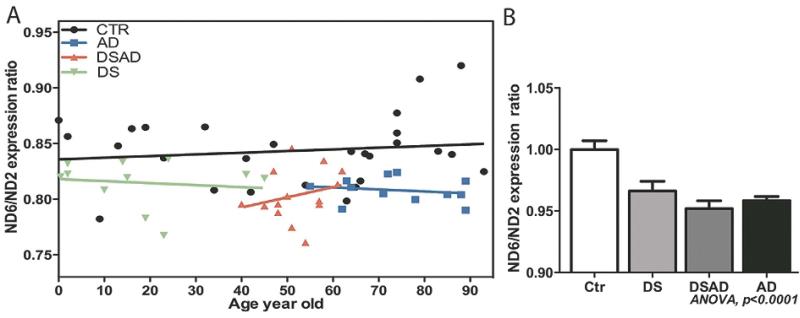
Fig. 6.
The ratio of mtDNA L-strand to H-strand transcripts in control, DS, DSAD, and AD brains. A) The correlation of mitochondrial L-strand/ H-strand gene expression ratio with age in all four groups. ND6 gene expression represents the L-stand transcription, and ND2 gene expression represents the H-Strand. B) The L-strand/ H-strand gene expression ratio was reduced in DS, DSAD, and AD brains relative to controls.

