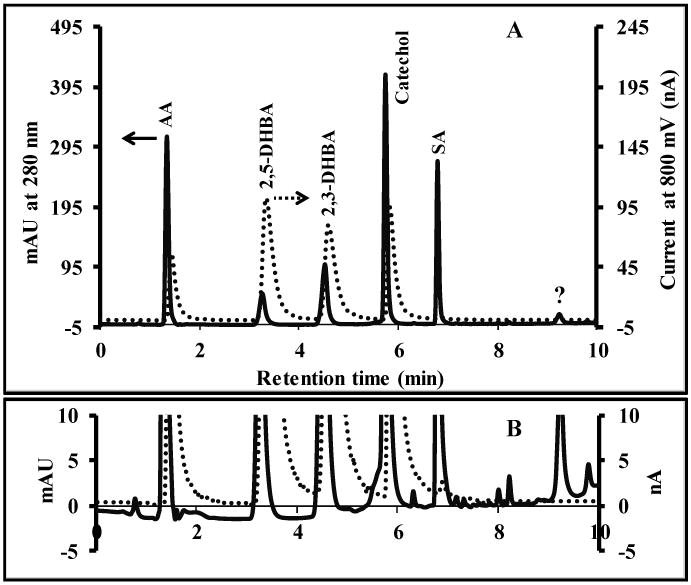
Fig. 2.

(A) Chromatogram of Fenton reaction products using the dual detection system. Dashed and solid lines represent amperometric detection and UV absorption signal respectively. (B) The differences in baseline between both detection methods. Separation conditions; column 2.7 μm Poroshell C18 (21×150 mm), injection volume of 10 μL, flow rate of 0.3 mLmin-1, mobile phase binary solvent system (A) 25 mM citrate buffer pH 3.5, and (B) CH3CN, gradient elution starting at 5% B and linearly increasing to 50% B within 5 minutes, held constant for 1 min before decreasing to 5% B in 1 minute and held constant for 3 minutes (10 min run time).
