
Figure 9.
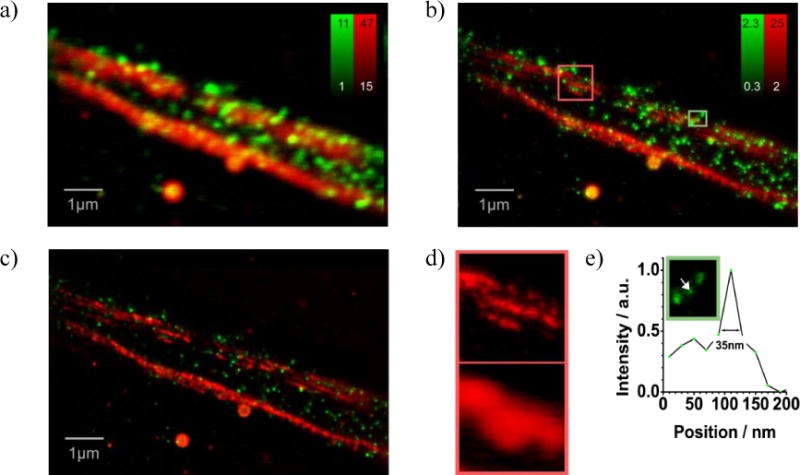
Comparison of fluorescence imaging techniques: a) Confocal, b) STED, and c) Richardson Lucy deconvolved STED images of neurofilaments (green: light subunits, red: α-internexin). d) In contrast to the confocal image, STED reveals three well-separated α-internexin strands of the axon. e) Structures of the light subunits exhibit a Full Width at Half Maximum (FWHM) < 40 nm, a measure for the reolution of the imaging method. Note the different organization of the light subunits and α-internexin. Reprinted with permission.[121]