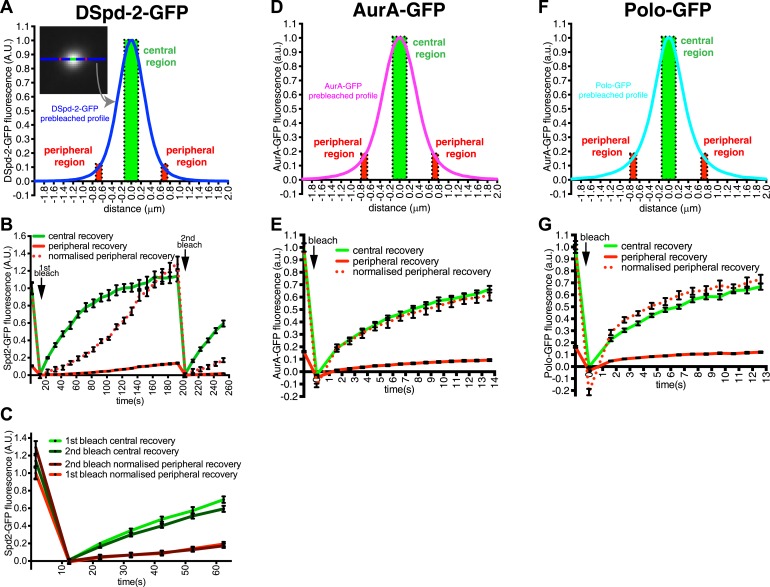
Figure 2. DSpd-2-GFP molecules spread away from the centrioles.
(A) Graph displays the pre-bleached profile of DSpd-2-GFP at centrosomes in Drosophila embryos (blue line, average of 10 centrosomes). Boxes highlight the central region of the PCM (green box) and peripheral regions of the PCM (red boxes) that were analyzed in a FRAP experiment. (B) Graph displays the average fluorescence intensity through time in the centre (green line) and periphery (red and dotted red lines) of the PCM after photobleaching. Arrows indicate times of photobleaching. The dotted red line represents the peripheral recovery after it has been normalized so that its initial pre-bleached value is equal to the initial pre-bleached value of the central recovery curve. Note how the central DSpd-2-GFP fluorescence recovery exhibits a typical logarithmic-shaped FRAP curve, with a fast initial rate that slows over time. In contrast, peripheral DSpd-2-GFP fluorescence recovery exhibits a very unusual behaviour as it is initially slow and then speeds up over time. This strongly suggests that DSpd-2-GFP molecules move from the centre to the periphery of the PCM (see main text). (C) Graph compares the initial recovery kinetics in the central (green lines) or peripheral (red lines) regions of the PCM after a first (light lines) and then second (dark lines) photobleaching event. The second photobleaching event took place when the rate of recovery in the centre was slow and the rate of recovery in the periphery was fast (see t = 200 s in B). Note that after the second bleaching event the central recovery returned to its original fast rate and the peripheral recovery returned to its original slow rate, showing that the increasing rate of recovery in the periphery was not due to peripheral binding sites gradually exchanging faster over time. (D–G) Graphs display the pre-bleached profiles (D and F) and recovery kinetics (E and G) of AurA-GFP (D and E) and Polo-GFP (F and G) at centrosomes in embryos (average of 11 centrosomes) in the same format as shown for DSpd-2-GFP (A and B). Note how the peripheral recovery curves of AurA-GFP (red and dotted red lines in E) and Polo-GFP (red and dotted red lines in G) both have a similar shape to their central recovery curves, indicating that the unusual peripheral kinetics of DSpd-2-GFP (red and dotted red lines in B) are not observed with other proteins that have a similar distribution around the centrioles. Error bars = SEM.

