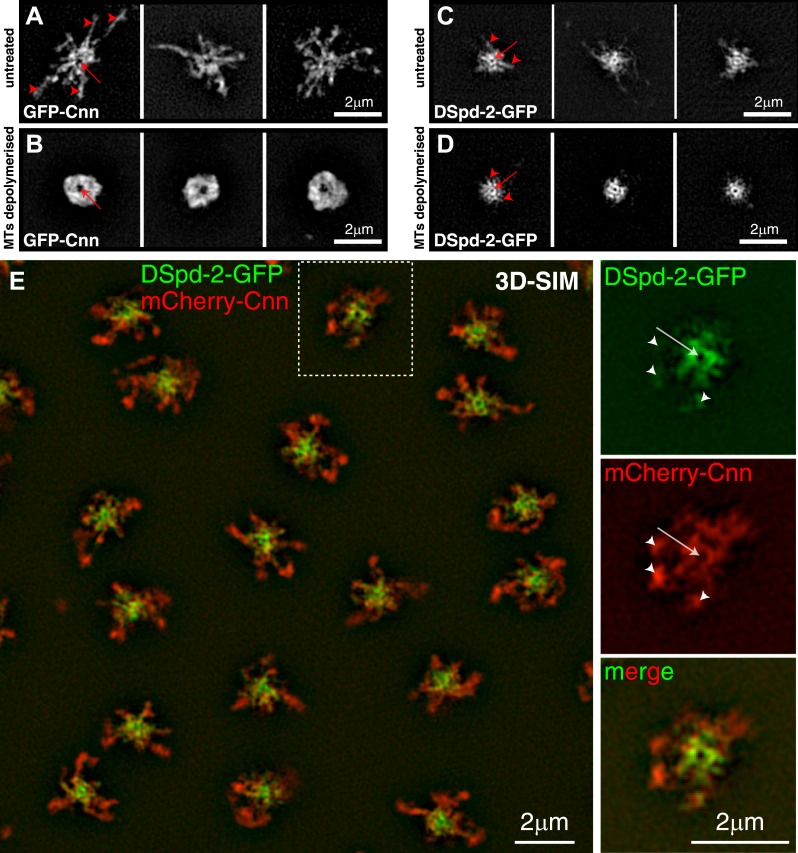
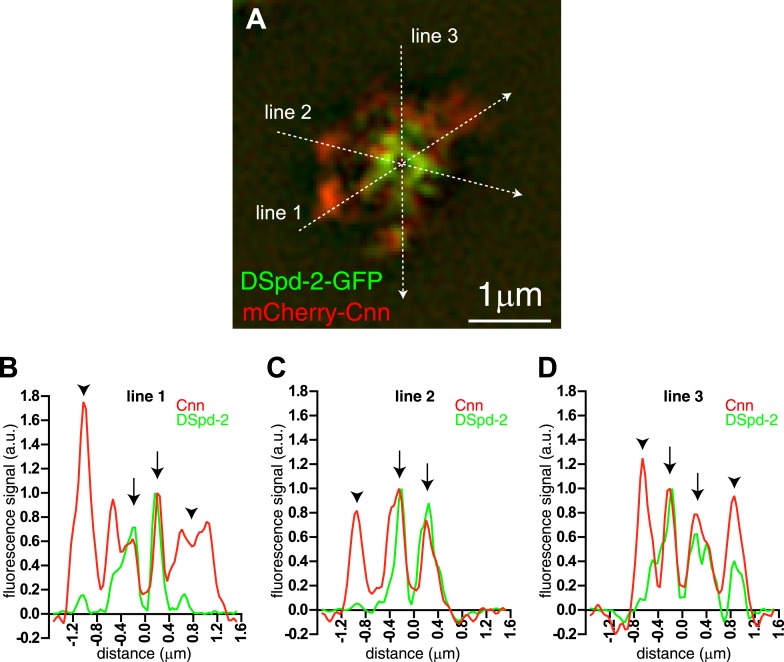
Figure 3. DSpd-2-GFP appears to form scaffold-like structure around the centrioles that partially co-localizes with the Cnn scaffold.
(A–D) 3D-SIM images of centrosomes from embryos expressing either GFP-Cnn (A and B) or DSpd-2-GFP (C and D) where the MTs are either present (A and C) or have been depolymerized by colchicine injection (B and D). (A) In untreated embryos, large projections of GFP-Cnn extend outwards (red arrowheads) from a central hollow (red arrow), which presumably contains the mother centriole. (B) After MT depolymerisation, the GFP-Cnn scaffold collapses into a largely amorphous structure; presumably, the molecular detail of the scaffold cannot be resolved even at this high resolution. The slightly larger central ‘hollow’ in the GFP-Cnn signal (red arrow) likely reflects the ability of the Cnn molecules to move a short distance away from the centre of the centrosome in the absence of microtubules (Conduit et al., 2014); these molecules then get ‘trapped’ in the more peripheral regions of the PCM, as they cannot efficiently leave the centrosome in the absence of MTs (Conduit et al., 2014). (C) In untreated embryos, DSpd-2-GFP appears as a series of spoke-like projections (red arrowheads) that extend away from a central ring (red arrow), which presumably surrounds the mother centriole; some of these projections weakly extend into the peripheral PCM. (D) After MT de-polymerisation, DSpd-2-GFP retains a large degree of its structure: there is a clear central ring (red arrow) with several spoke-like projections extending outwards (red arrowheads); these projections, however, no longer appear to extend into the more peripheral regions of the PCM. (E) Two-colour 3D-SIM images of centrosomes in untreated embryos co-expressing DSpd-2-GFP (green) and mCherry-Cnn (red). The panels on the right are enlargements of the boxed centrosome in the panel on the left; note the clear hollow in the centre of the centrosome (arrows), and how the mCherry-Cnn signal extends further away from the centrioles than the DSpd-2-GFP signal, although weak DSpd-2-GFP fluorescence can often be observed in the same region as the more peripheral mCherry-Cnn (arrowheads). See also Figure 3—figure supplement 1.


