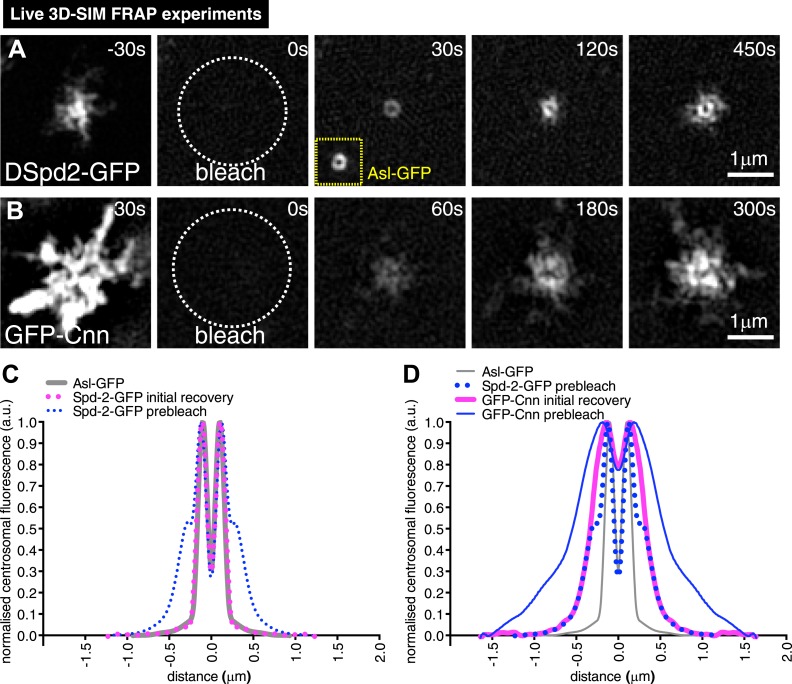
Figure 4. 3D-SIM FRAP analysis of DSpd-2-GFP and GFP-Cnn behaviour at centrosomes.
(A and B) 3D-SIM images show the dynamic behaviour of DSpd-2-GFP (A) and GFP-Cnn (B) at centrosomes in living Drosophila embryos after FRAP; time before and after photobleaching (t = 0) is indicated. (A) DSpd-2-GFP fluorescence initially recovers in a toroid shape around the centriole (A, t = 30 s), which has similar dimensions to unbleached Asl-GFP (yellow inset). The protein then moves slowly outwards, forming dynamic projections that spread away from the centriole. (B) GFP-Cnn fluorescence initially recovers in a broader region around the centrioles (t = 60 s in B), which has similar dimensions to the pre-bleached DSpd-2-GFP signal (t = −30 s in A). (C) Graph compares the average prebleached (dotted blue line) and initial recovery (dotted pink line) profiles of DSpd-2-GFP to the average unbleached profile of Asl-GFP (grey line); all profiles were normalized so that their peak value is equal to 1. Note how the initial DSpd-2-GFP recovery profile is essentially identical to the un-bleached Asl-GFP profile. (D) Graph compares the average pre-bleached (solid blue line) and initial recovery (solid pink line) profiles of GFP-Cnn, to the average pre-bleached profile of DSpd-2-GFP (dotted blue line), and the average unbleached profile of Asl-GFP (grey line); all profiles were normalized so that their peak value is equal to 1. Note how the initial GFP-Cnn recovery profile is very similar (particularly in the more peripheral regions), to the pre-bleached DSpd-2-GFP profile, but is quite distinct from the pre-bleached Asl-GFP profile. See also Video 2.

