. 2014 Aug 22;3:e03399. doi: 10.7554/eLife.03399

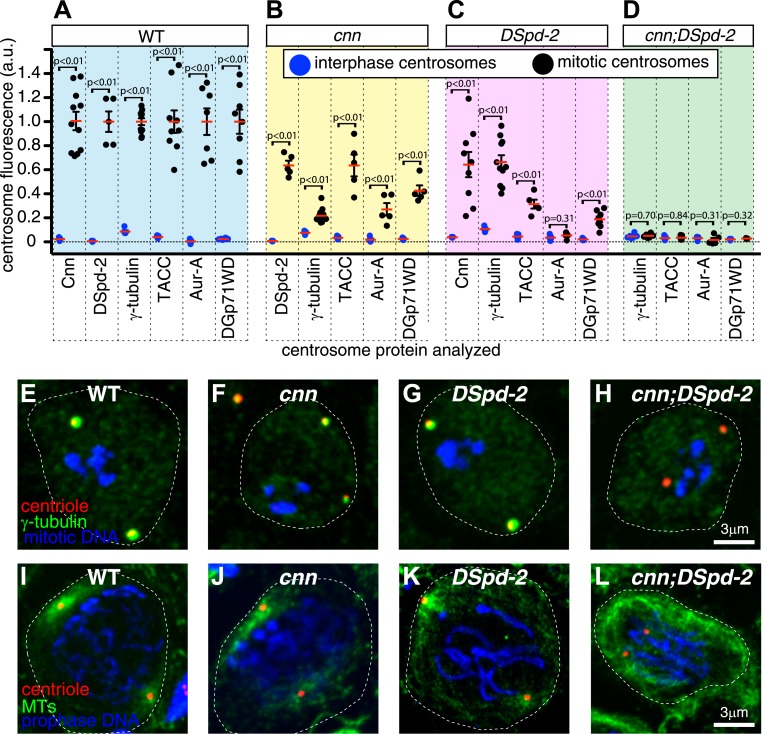
Figure 9. Cnn and DSpd-2 cooperate to recruit the mitotic PCM.

(AD) Graphs show the average fluorescence intensities of interphase (blue dots) and mitotic (black dots) centrosomes from either WT (A), cnn mutant (B), dspd-2 mutant (C), or cnn;dspd-2 double mutant (D) larval brain cells stained for various centrosomal proteins (as indicated below graphs). Each data-point represents the average centrosome value from one brain. The horizontal red bars indicate the average value of all the brains. All the PCM proteins are still partially recruited to centrosomes in the absence of Cnn or DSpd-2 (with the possible exception of Aurora A, which does not appear to be recruited in the absence of DSpd-2). The mitotic PCM levels do not rise above interphase levels in the absence of both Cnn and DSpd-2, indicating that centrosome maturation has been abolished. (EL) Images show typical mitotic cells from either WT (E and I), cnn (F and J), dspd-2 (G and K), or cnn;dspd-2 double mutant (H and L) larval brain cells stained for the centriole marker Asl (red), mitotic DNA (phospho-histone H3, blue), and either the PCM marker γ-tubulin (green, EH) or MTs (IL, green). Error bars = SEM. See also Figure 9—figure supplements 1 and 2.

DOI: http://dx.doi.org/10.7554/eLife.03399.019

Figure 9.

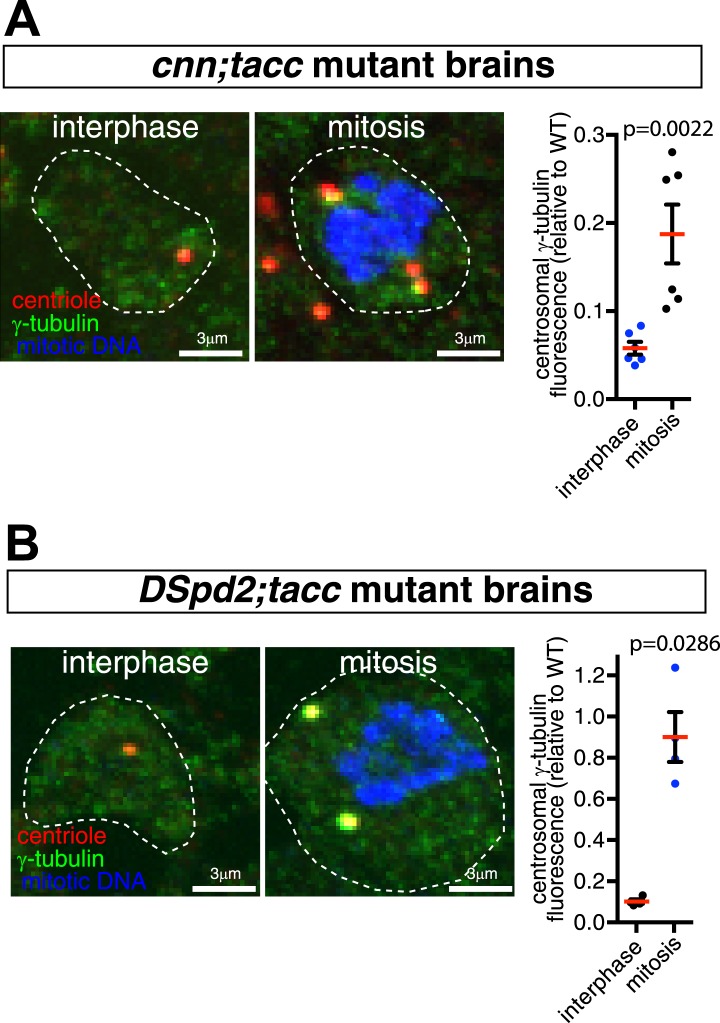
Figure 9—figure supplement 1. Centrosome maturation is not abolished in cnn;tacc or dspd-2;tacc double mutants.

Figure 9—figure supplement 1.

(A and B) Images and associated graphs show mitotic and interphase larval brain cells stained for γ-tubulin (green), the centriole marker Asl (red), and mitotic DNA (phospho-histone H3, blue) from either cnn;tacc double mutant (A) or dspd-2;tacc double mutant larvae (B). Graphs display the average fluorescent intensities of mitotic and interphase centrosomes (relative to a WT mitotic value of 1) stained for γ-tubulin. Each data-point represents the average centrosome value from one brain. Note how centrosomes still partially mature in each mutant combination, as the levels of γ-tubulin centrosomal fluorescence are significantly higher in mitotic cells than in interphase cells.
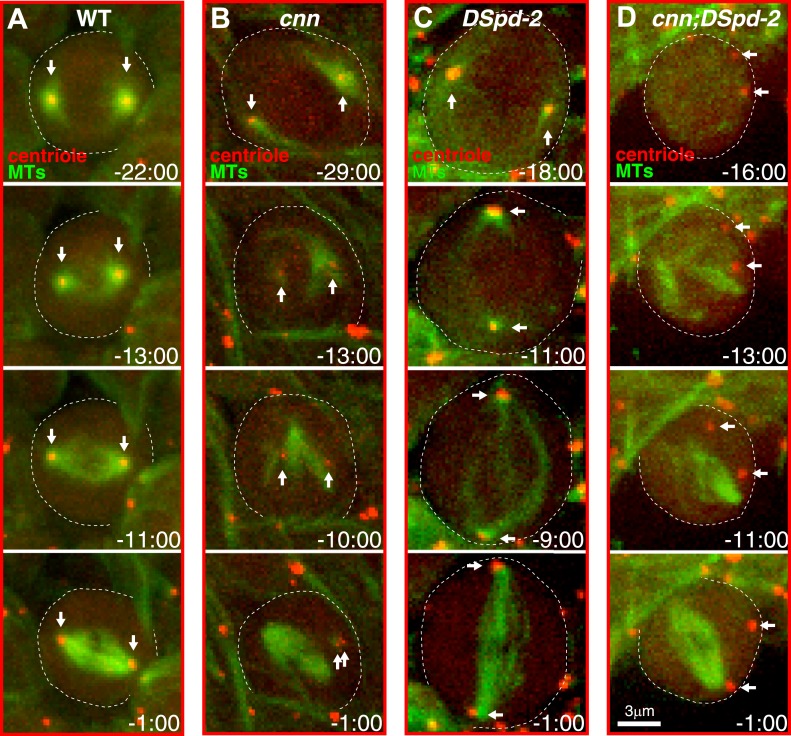
Figure 9—figure supplement 2. Centrosomes in cnn;dspd-2 double mutants fail to organise MTs.

Figure 9—figure supplement 2.

Images show selected time-points from videos of either WT (A), cnn (B), dspd-2 (C), or cnn;dspd-2 double mutant (D) brain cells expressing the MT marker Jupiter-mCherry (pseudo-coloured green) and the centriole marker GFP-PACT (pseudo-coloured red); time before and after anaphase onset (t = 0 s) is indicated. Arrows indicate the position of the centrioles. The centrioles in WT cells, or cnn or dspd-2 single mutant cells can organize MT asters, but no centriole-associated MTs can be detected in the cnn;dspd-2 double mutants.