Figure 1.

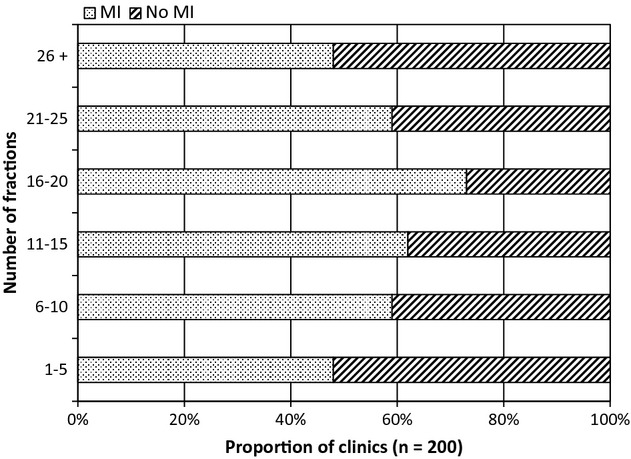
Bar chart showing the relationship between the numbers of fractions received and the rate of medical intervention (MI) required during treatment review clinics.

Bar chart showing the relationship between the numbers of fractions received and the rate of medical intervention (MI) required during treatment review clinics.