
Figure 2. Role of BM APCs and mTECs in thymic Treg cell selection.
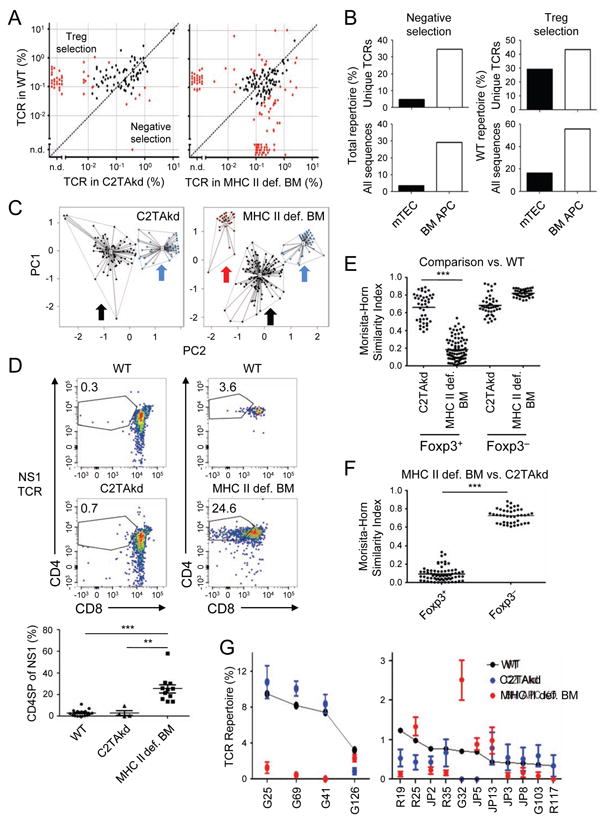
(A) Changes in Treg cell TCR frequency with manipulation of MHC II expression on BM APCs or mTECs. Data shown are the frequency of Foxp3+ CD4SP TCRs in MHC II def. BM or C2TAkd versus control chimeras as per Figure 1A. (B) Summary of effects on the Treg cell TCR repertoire with modulating MHC II on mTECs or BM APCs. Data shown are the percentage of unique TCRs (top) or total sequences (bottom) in the filtered data set that are interpreted to undergo APC-dependent negative selection (left), or Treg cell selection (right), based on statistical significance and ≥ 80% percent change in frequency versus WT. Note that negative selection is based on all of the TCRs in a given plot in (A), whereas Treg cell selection represents the frequency of the WT repertoire that is dependent on the indicated APC to avoid incorporating effects of negative selection. (C) PCA of TCR frequencies. Like Figure 1C, red dots/arrow correlate with negatively selected TCRs (variances: MHC II def. BM = 17.5%, C2TAkd = 11.6%), black dots/arrow unaffected TCRs, and blue dots/arrow Treg TCRs (variances: MHC II def. BM = 41.6%, C2TAkd = 28.0%). (D) BM APCs negatively select TCR NS1 in vivo. Data shown are representative flow cytometry plots (top) and summary (bottom) of intrathymic injection of Rag 1-/-thymocytes retrovirally-transduced with NS1 and transferred into WT versus C2TAkd (left) or WT versus MHC II def. BM (right) chimeric mice (data pooled from at least two independent experiments with 2 replicates per experiment). ***p < .001, Mann-Whitney U. (E, F) Morisita-Horn similarity analysis of Treg and Tconv cell TCR repertoires. In (E), the TCR repertoire from each MHC manipulation is compared with the WT repertoire, whereas in (F) the comparison is between the MHC II def. BM APC and C2TAkd repertoires. An index value of 1 indicates that the two samples are completely similar whereas an index value of 0 means they are completely dissimilar. (G) Analysis of individual Treg cell TCRs from the WT condition. The top 15 individual Foxp3+ CD4SP TCRs from aggregated WT data sets are shown sorted by frequency, along with the corresponding frequency in the C2TAkd or MHC II def. BM Treg TCR repertoires. See also Figure S2.