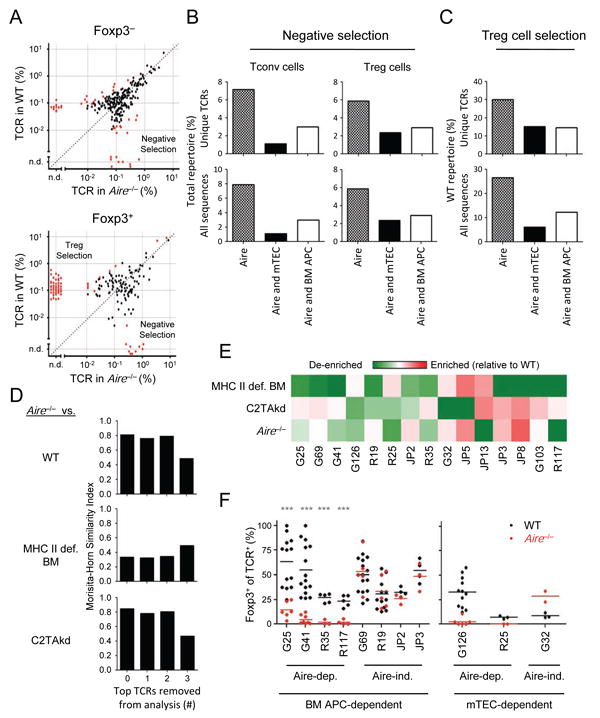
Figure 5. Aire selects a subset of thymic Treg cells.

(A) Changes in TCR frequency with Aire. The frequencies of Foxp3– (top panel) and Foxp3+ (bottom panel) TCRs in WT and Aire–/– mice are plotted as per Figure 1A and 2A. Red dots indicate TCRs that are significantly different by Mann-Whitney U (p < .05). (B, C) Summary of the effects of Aire on the TCR repertoire. Data shown are the percentage of unique TCRs (top) or total sequences (bottom) interpreted to undergo Aire-dependent negative selection (B) or Treg cell selection (C), as described in Figures 1B and 2C. (D) Morisita-Horn similarity analysis of Treg cell TCR repertoires from Aire–/– versus WT mice (top), or MHC-II-def. BM (middle) or C2TAkd (bottom), with leave-one-out analysis of the highest frequency Aire–/– TCRs as per Figure 3B. (E) Analysis of the top 15 WT Treg cell TCRs for their dependence on BM APCs, mTECs, and Aire. The heatmap shows the effect of an indicated experimental condition on an individual TCR (% of TCR in condition / [% in WT + % in condition]). Values < 0.5 indicate a loss of the TCR in the condition (green color), implying that the selection of the Treg cell TCR is dependent on the condition. Red represents values > 0.5 indicating enrichment of TCR in condition relative to WT, suggestive of negative selection. (F) In vivo analysis of BM APC- and mTEC- dependent Treg cell TCRs. As per Figure 3, Treg cell differentiation in response to Aire was assessed using Rag1–/– thymocytes transduced with retrovirus expressed Treg cell TCRs showing varying dependence on Aire, BM APCs, and mTECs by TCR repertoire analysis. Each TCR was tested in at least 2 independent experiments with 1-3 replicates per experiment. Each dot represents data from a single host. Mann-Whitney U test, ***p < .001. See also Figure S5.
