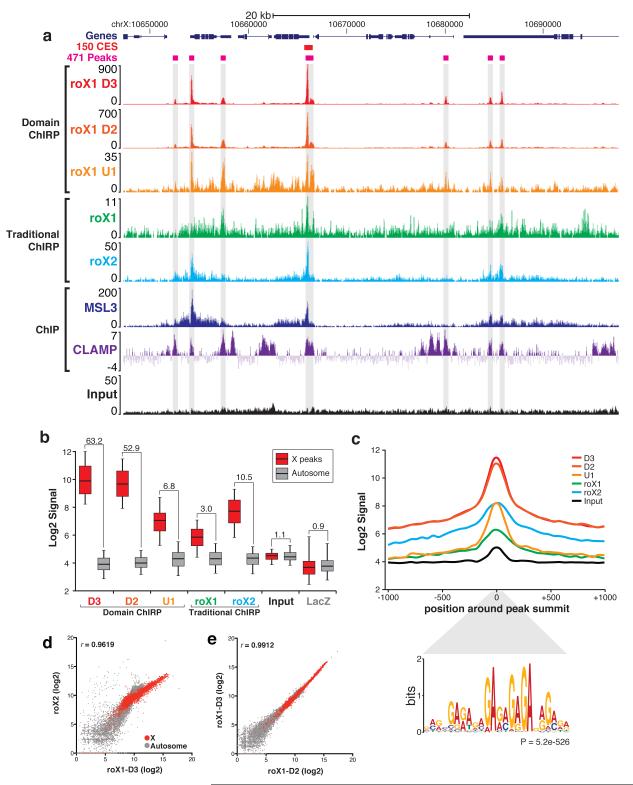
Figure 4.
dChIRP boosts signal-to-noise ratio relative to traditional ChIRP-sequencing. (a) Genomic tracks of dChIRP-seq results at representative X-linked locus. Sequencing tracks from roX1 dChIRP (U1, D2, D3) and traditional ChIRP (roX1, roX2). roX1 peaks (gray highlight) align with peaks from roX2, MSL3 ChIP, and CLAMP ChIP17,20. (b) Comparison of signal from the X and noise on autosomes. Signal was calculated at 457 peaks on the X and 457 random loci on autosomes. Box-plot represents 1st, 2nd, and 3rd quartiles; whiskers denote 5th and 95th percentiles. Signal-to-noise ratio (X peak mean to autosome mean) is indicated above each sample. (c) Average peak diagram of 457 peaks on X. roX1 dChIRP produces higher signal and more focal peaks than traditional ChIRP. The MRE GA-repeat motif is significantly enriched within peaks (P = 5.2e-526, MEME36) and is located specifically at peak summits (P = 5.3e-182, CentriMo36). (d, e) Correlation between ChIRP-sequencing experiments. (d) roX1-D3 dChIRP and roX2 ChIRP signal are highly correlated (r=0.9619), especially on the X chromosome (red). (e) roX1-D2 and -D3 dChIRP are very highly correlated (r=0.9912). roX1 D2, D3, and roX2 co-occupy the same loci on the X.

