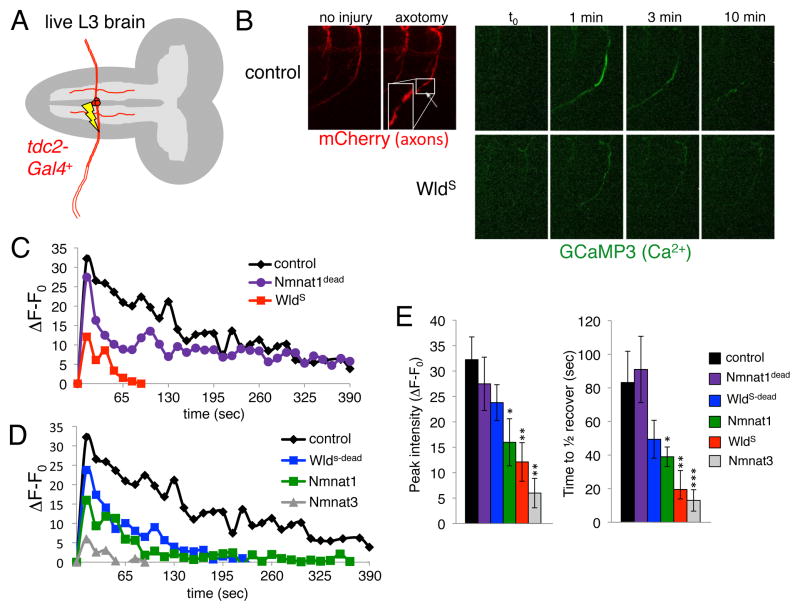
Figure 2. In vivo laser axotomy induces a dramatic rise in axonal Ca2+ that is suppressed by WldS.
(A) tdc2-Gal4 labels 3 axons in each peripheral nerve, only one segment is illustrated.
(B) Axons were labeled with mCD8::mCherry, axonal Ca2+ was monitored by co-expressing GCaMP3 in the tdc2-Gal4+ subset of neurons. Note the breakage of the axon after laser axotomy (red, mCherry). Axonal Ca2+ levels one minute after axotomy (green, GCaMP3).
(C,D) Representative traces showing Ca2+ responses in axon fragments distal to the injury site over time. Genotypes as indicated.
(E) Quantification of peak Ca2+ intensities and time to ½ recovery from average peak intensity for each genotype listed. n≥5 live samples for each genotype and time point versus control. *, p<0.05; **, p<0.01; ***, p<0.001.

