Figure 2.
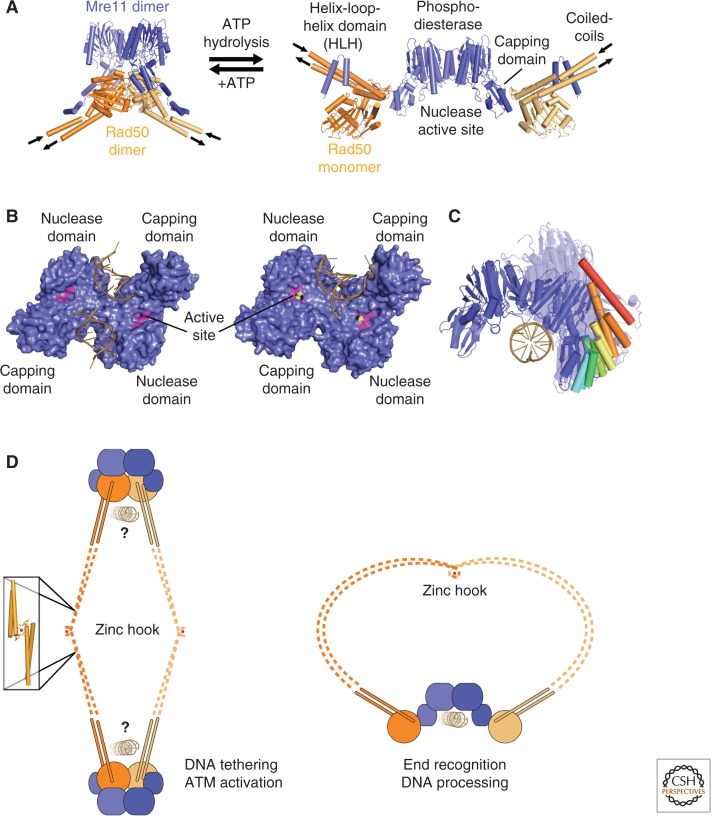
The Mre11 nuclease and its regulation by Rad50. (A) Structure of the ATP-bound and ATP-free T. maritima MR complex. The PDB codes are 3QG5 and 3THO (Lammens et al. 2011; Möckel et al. 2012). (B) Comparison of Mre11-DNA structures: the surface of the Mre11 dimer (blue) bound to synaptic DNA (left) and branched DNA (right). In the right structure, the active site (magenta) coordinates two manganese ions (yellow). The PDB codes are 3DSC (synaptic DNA) and 3DSD (branched DNA, Williams et al. 2008). (C) Mre11 structure comparison: dimeric crystal structures are aligned onto the left monomer of P. furiosus Mre11 (blue) (PDB code is 1S8E, Arthur et al. 2004). For clarity, the overlaid monomers are not depicted, the right monomers are transparent, and the first α-helix from the capping domain is marked from blue to red to highlight the differences. DNA (sand) indicates the accessible nuclease active site. The PDB codes are 1II7 (Hopfner et al. 2001), 3DSD, 3DSC (Williams et al. 2008), 4HD0 (Limbo et al. 2012), 3AUZ, 3AV0 (Lim et al. 2011), 3THO, 3THN (Möckel et al. 2012), 3QG5 (Lammens et al. 2011), 2Q8U (Das et al. 2010), 4FBQ, 4FBW, 4FBK, and 4FCX (Schiller et al. 2012). (D) MR model for DNA tethering and processing: Mre11 (blue) in complex with Rad50 (orange) forms intercomplex (left) and intracomplex (right) interactions through the zinc hook (zinc ion, red).

