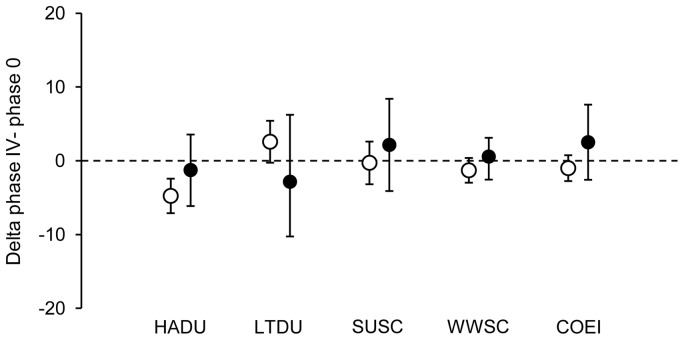
Figure 5. Intra-specific body mass variation for the studied species.
Average deltas, representing the difference between body mass recorded at the phase IV of the moult in which seaducks are able to re-fly and initial body mass, and their respective confidence intervals. When the confidence intervals exclude the zero line, the delta is declared significant at 5% level (see Materials and methods).

