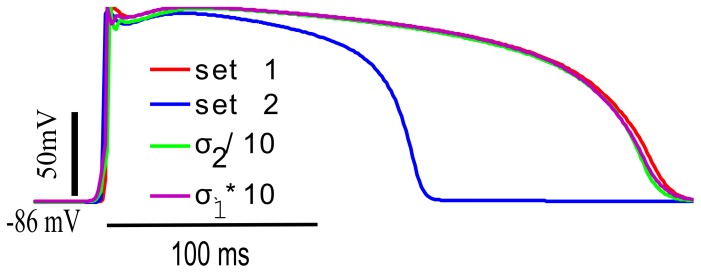
Figure 5. Effect of changing tissue coupling with the two parameters sets of TNNP model.
Red and blue curve show the APs for parameter set 1 and 2 for TNNP model. The green curve shows the AP for parameter set 2 when the coupling has been decreased by a factor of 10. The purple dotted curve shows the curve for parameter set1 with the coupling increased by a factor of 10.

