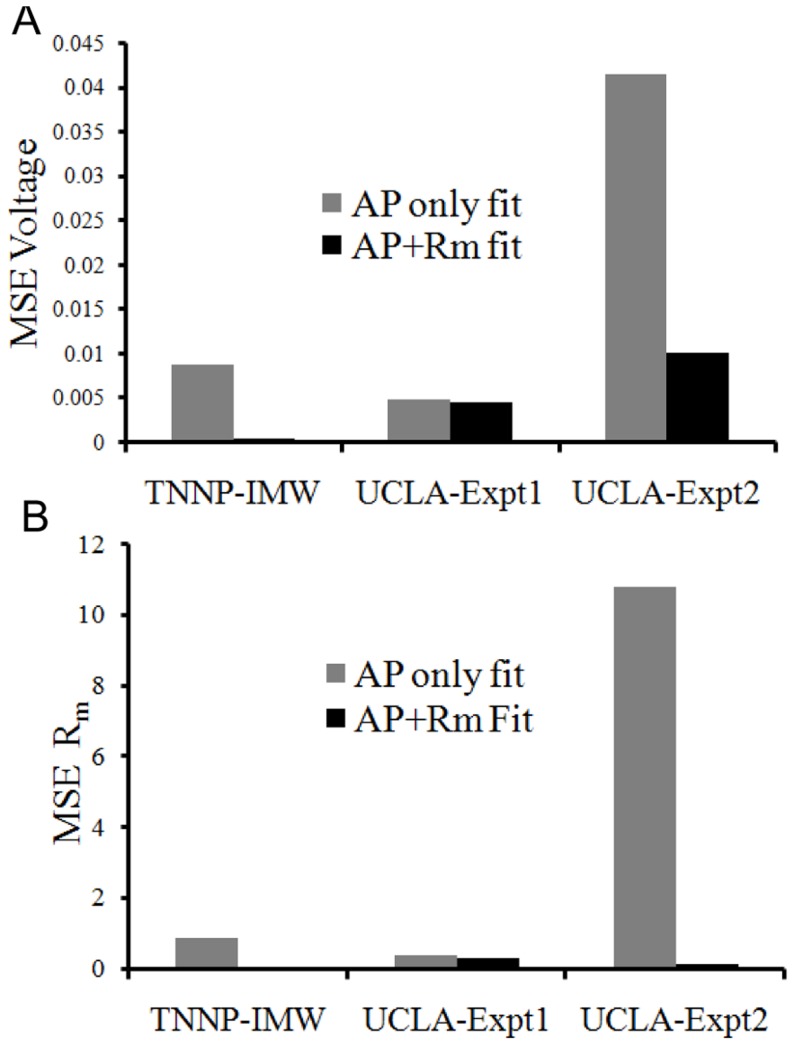
Figure 8. Mean square errors.
Error for fitting the TNNP to the IMW model (TNNP-IMW), and fitting the UCLA rabbit model to experimental data sets 1 (UCLA-Expt1) and 2 (UCLA-Expt2) are shown. Grey bars shows MSE for fitting AP only while black bars show the MSE of fitting AP+Rm.(A). MSE of AP voltage normalized by square of height of AP. (B) MSE of Rm normalized by square of actual membrane resistance at particular voltage point.

