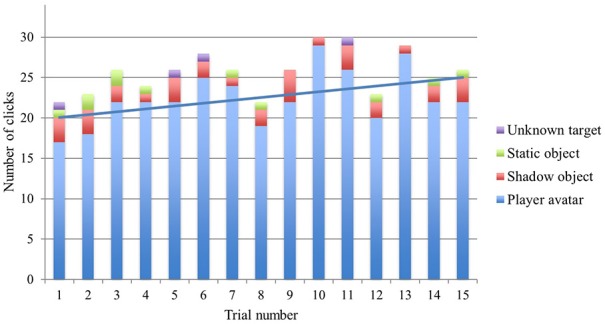
Figure 3.

Cumulative column chart showing changes in the number of clicks on different targets over the 15 trials. The maximum number of possible clicks per trial number is 34 (2 players × 17 teams). The linear trend line refers to avatar clicks only. For details of how the different virtual objects were determined to be the target of a click, see the methods section in Froese et al. (2014).
