
Fig. 2.
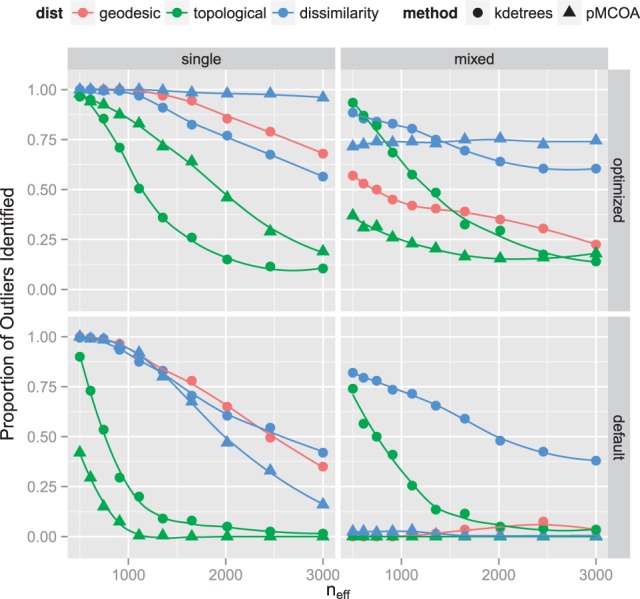
Summary of simulation results comparing performance of kdetrees and Phylo-MCOA for various values of the effective population size. The proportion of simulated datasets in which the methods identified the outlier tree is shown. The top two plots use tuning parameters chosen based on results of the ROC simulation, whereas the bottom plots use default values. For kdetrees, the optimal tuning parameter was , whereas for Phylo-MCOA, it was . The default values are both