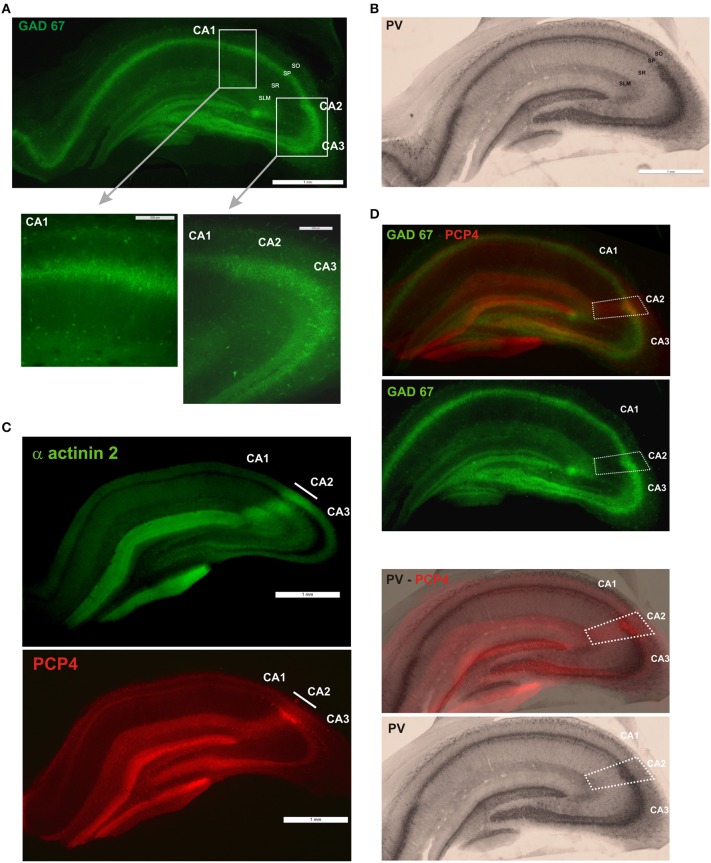
Figure 1.
Definition of the borders of the CA2 region. (A) GAD67 fluorescent staining (scale bar 1 mm). GAD-positive neurons in the CA1, CA2, and CA3 regions are shown at higher magnification in the bottom panels (scale bars 200 μm). SO, Stratum Oriens; SP, stratum pyramidale; SR, stratum Radiatum; SLM, Stratum Lacunosum Moleculare; SL, Stratum Lucidum. (B) Immunoperoxidase staining of parvalbumin (PV)-positive interneurons (scale bar 1 mm). (C) Immunofluorescence staining for α actinin 2 protein and purkinje cell protein 4 (PCP4) determined the borders of the CA2 region. Scale bars, 1 mm. (D) The borders of CA2 (white dotted line) were defined by superimposition of the PCP4 labeling and GAD67 and immunoperoxidase stainings.

