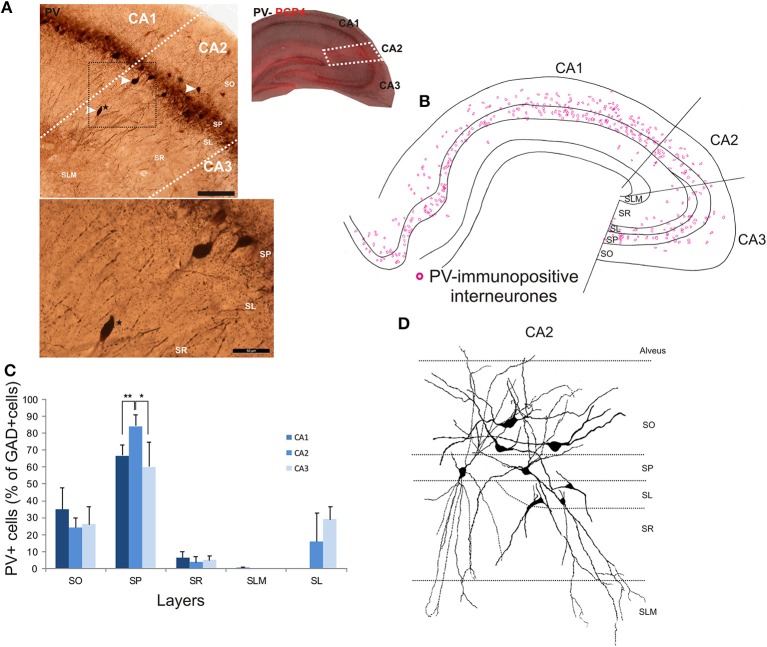
Figure 4.
Distribution of parvalbumin (PV)-immunopositive interneurons in CA2. (A) Example of immunoperoxidase staining for PV. The CA2 region was delineated by superimposing the PV staining with the PCP4 staining (right panel) and represented with white dotted lines. Some immunolabeled interneurons in CA2 are indicated with white arrows. Note that the darker staining in SP represents axonal arbors of PV-positive cells. Staining (black dotted square) is represented at a higher magnification in the bottom panel. A PV-immunopositive interneuron (black star in both panels) was located in SR of the CA2 region. Scale bars 200 μm (top panel) and 50 μm (bottom panel). SO, Stratum Oriens; SP, stratum pyramidale; SR, stratum Radiatum; SLM, Stratum Lacunosum Moleculare; SL, Stratum Lucidum. (B) Distribution of PV-immunopositive cell bodies in all layers of the three CA regions, CA1, CA2, and CA3 (superimposition of five 50 μm-thick sections). PV-positive somata were mainly located in SO and SP of CA2, with very few cells in SR and none in SLM. (C) Distribution of PV-positive cells expressed as percentage of GAD-immunopositive neurons in CA1, CA2, and CA3 (5 sections- n = 7). *P = 0.01 to 0.05; **P = 0.001 to 0.01. (D) Partial reconstructions of PV-positive cells in the CA2 region. Interneurons with somata located in SO had mostly horizontal dendrites. PV-immunopositive cells with cell bodies in SP had vertical aspiny dendrites. However, some displayed horizontal dendrites. A few cells in SL were PV-immunopositive. Partial reconstructions of these cells revealed that their dendrites branched close to the soma and extended into SP, SR, and SLM.

