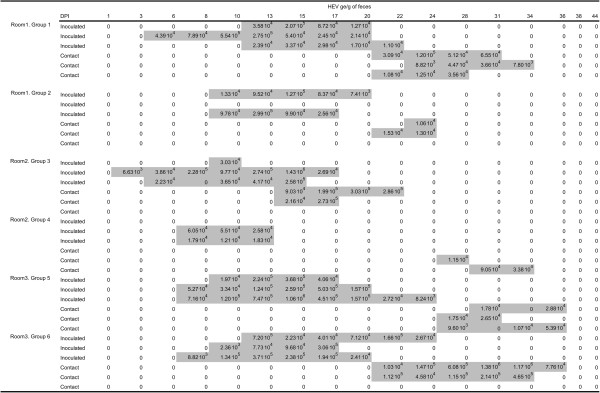
Figure 2.

Quantitative RT-PCR results on individual fecal samples in direct contact groups (rooms 1 to 3). Shaded zones correspond to periods on which infected individuals were considered infectious, corresponding to the time between the first and last HEV positive fecal samples for each animal.
