Figure 1.

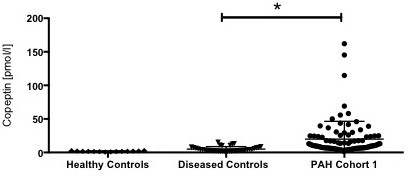
Copeptin levels in controls and patients with PAH from cohort 1 at baseline. Data are shown as median (IQR). Differences between the groups were assessed using Kruskal–Wallis one-way analysis of variance. * indicates p < 0.05.

Copeptin levels in controls and patients with PAH from cohort 1 at baseline. Data are shown as median (IQR). Differences between the groups were assessed using Kruskal–Wallis one-way analysis of variance. * indicates p < 0.05.