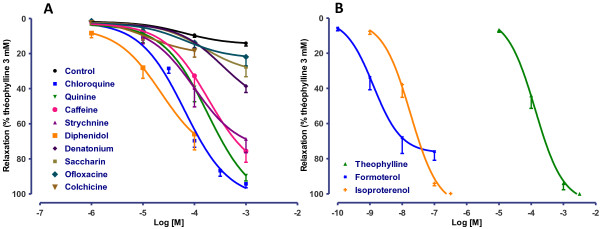
Figure 2.

Concentration-response curves for TAS2R agonists (chloroquine, quinine, caffeine, strychnine, denatonium, saccharin and ofloxacin (all 1 μM to 1 mM) and colchicine and diphenidol (1 μM to 0.1 mM)) on human bronchi (A), and reference relaxants (theophylline from 10 μM to 3 mM, formoterol from 0.1 nM to 0.1 μM and isoproterenol from 1 nM to 0.3 μM) (B). Control curves correspond to experiments in which only vehicle (water) was added to the organ bath. The results with TAS2R agonists and reference molecules are expressed as a percentage of the relaxation observed with 3 mM theophylline (mean ± SEM from 9 to 24 independent experiments).
