
Figure 3.
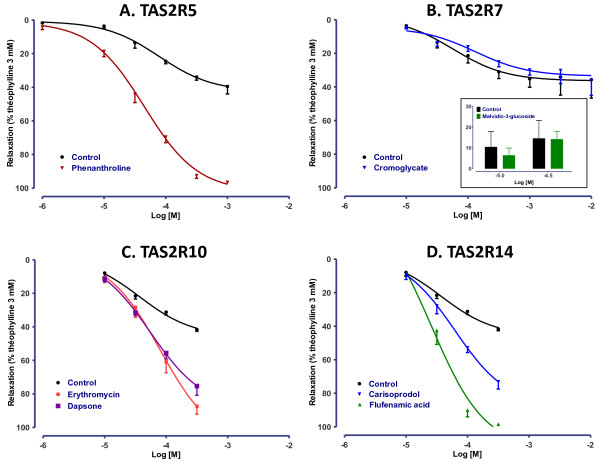
Concentration-response curves of agonists selective for (A) TAS2R5 (phenanthroline, 10 μM to 1 mM), (B) TAS2R7 (sodium cromoglycate, 10 μM to 10 mM and malvidin-3-glucoside, 10 and 30 μM), (C) TAS2R10 (erythromycin and dapsone, 10 μM to 0.5 mM) and (D) TAS2R14 (carisoprodol and flufenamic acid, 10 μM to 0.5 mM). Control curves correspond to experiments in which only vehicle (DMSO or water) was added to the organ bath. The results are expressed as a percentage of the relaxation observed with 3 mM theophylline (mean ± SEM from 3 to 22 independent experiments).