
Figure 6.
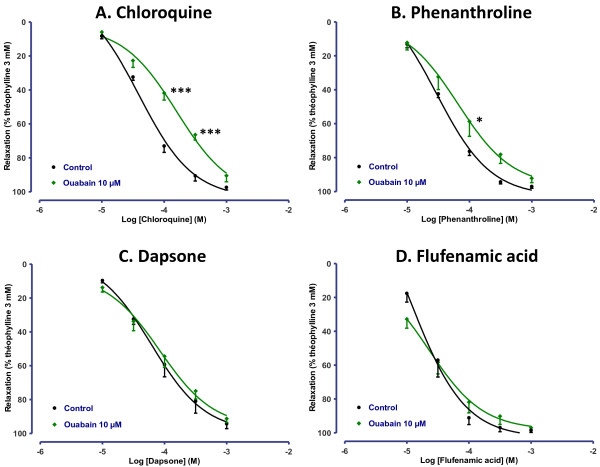
Concentration-response curves of (A) chloroquine, (B) phenanthroline, (C) dapsone and (D) flufenamic acid in human bronchi pretreated or not with 10 μM ouabain. The results are expressed as a percentage of the relaxation observed with 3 mM theophylline (mean ± SEM from 5 independent experiments). *p < 0.05; ***p < 0.001.