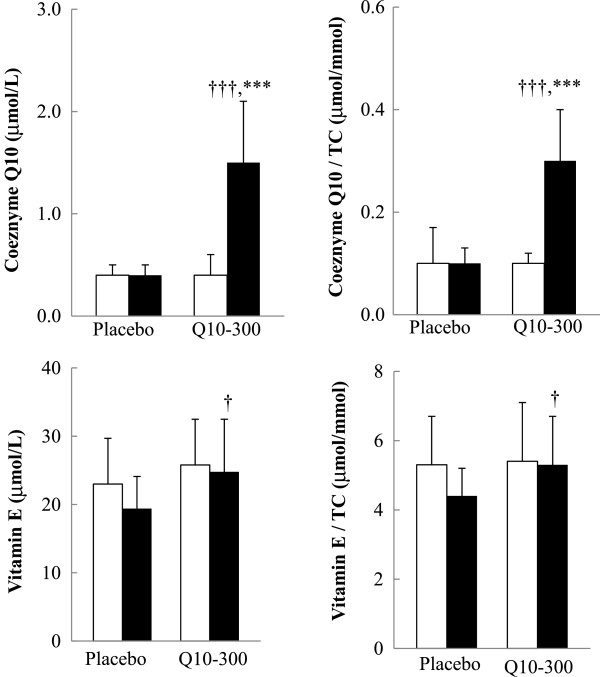
Figure 2.

Coenzyme Q10 and vitamin E concentrations. Data are means ± SD. □ week 0, ■ week 12. *Values were significantly different after intervention within the group (***P < 0.001). †Values were significantly different between the placebo and Q10-300 groups (†P < 0.05, †††P < 0.001). TC, total cholesterol.
