Figure 1.

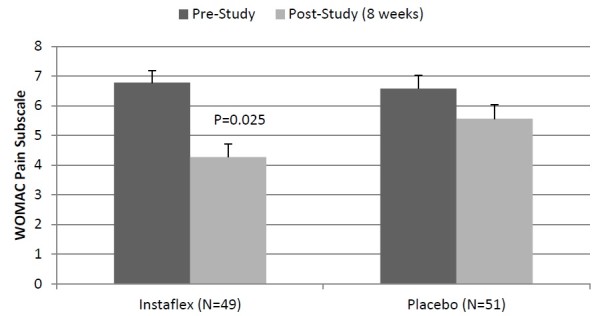
WOMAC joint pain in Instaflex compared to placebo (interaction effect, P = 0.025). The P-value in the graph represents the pre-to-post study contrast between Instaflex and placebo groups.

WOMAC joint pain in Instaflex compared to placebo (interaction effect, P = 0.025). The P-value in the graph represents the pre-to-post study contrast between Instaflex and placebo groups.