
Figure 3.
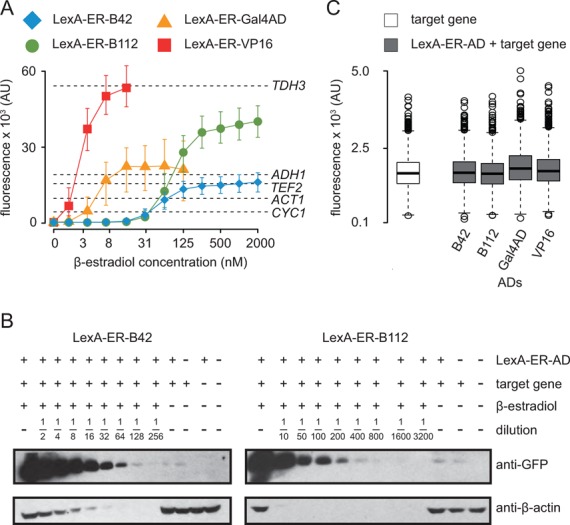
Induction levels and tight regulation of LexA-ER-AD. (A) The expression levels of constitutive promoters were plotted on top of the LexA-ER-AD 24-h titration curves obtained by flow cytometry shown in Figure 2. We only considered the concentration ranges of β-estradiol in which our expression system reached a steady state. The x-axis is logarithmic. Symbols represent the median and error bars the 25th and the 75th percentiles of the fluorescence signal (area) distribution measured by the cytometer. Each dashed horizontal line represents the median of the yellow fluorescence signal distributions obtained by expressing Citrine from the constitutive promoters indicated on the right side of the graph (FRY744, FRY745, FRY746, FRY748 and FRY757). (B) Western blots to determine protein induction fold by LexA-ER-B42 (left) and LexA-ER-B112 (right) upon incubation with 2000 nM β-estradiol in SDC for 24 h (strains: FRY418 and FRY667). Citrine levels were assayed using an anti-GFP antibody. As loading control, we detected the β-actin with an anti-β-actin antibody. The induced samples were diluted as indicated. As controls, we loaded the un-induced strains (FRY418 and FRY667), a strain bearing only the target gene (Citrine under the control of four lexA boxes, FRY484), a strain bearing only the transcription factor (FRY312) and an ‘empty’ strain (FRY11). (C) Flow cytometry of the basal activity of LexA-ER-AD. Cells were cultivated in SDC lacking β-estradiol. The target gene strain contained only the target gene with four lexA boxes in its promoter (FRY484); the LexA-ER-AD + target gene strains contained both transcription factor and target gene (FRY418, FRY666, FRY667 and FRY743). The LexA-ER-AD variant is indicated under each boxplot, which summarizes the distribution of the fluorescence signal (height) measured.