
Figure 2.
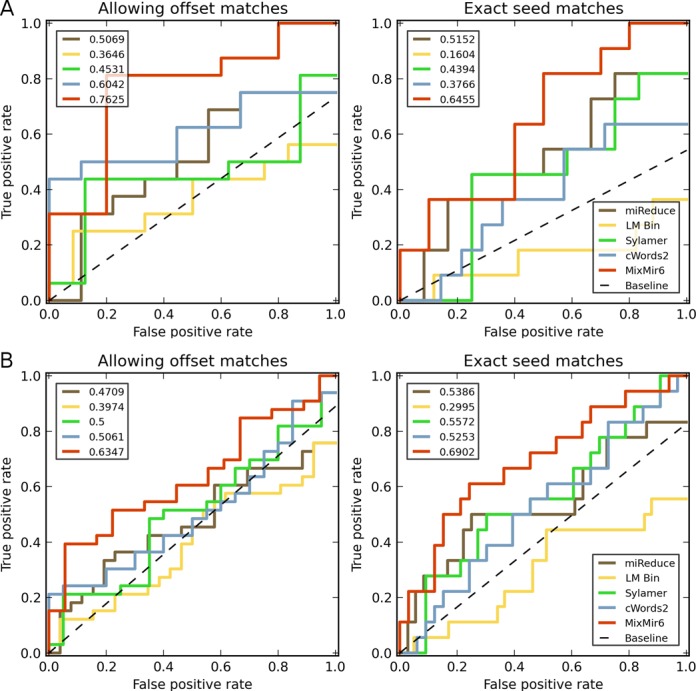
Truncated receiver operating characteristic (ROC) curves comparing the six methods examined and their performance in ranking motifs from miRNAs in miRBase. Dotted line represents expected random performance. Top left number indicates the area under the curve for each method. Left: results when allowing for offset seed sequence matching, Right: results when restricting to exact seed matches only. (A) ROC curve for the top 20 motifs returned by each method. (B) ROC curve for the top 50 motifs returned by each method.