
Figure 5.
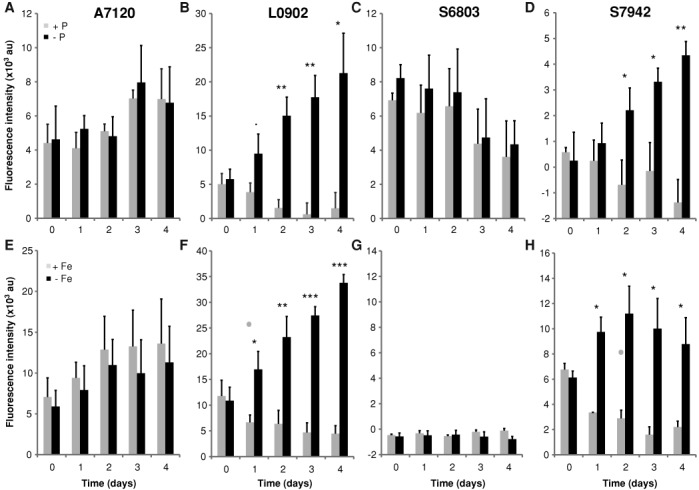
Promoter activities for PphoA and PisiA driving GFPmut2 in inducing and non-inducing conditions over a time course of four days post induction in four cyanobacterial strains. (A)–(D) PphoA activities in phosphate replete (gray bars) versus depleted (black bars) cultures. (E)–(H) PisiA activities in iron replete vs. depleted cultures. Promoter activities were measured as GFPmut2 fluorescence ± SD of triplicate cultures grown from three independent colonies adjusted to OD750 of 0.2 (0.1 for A7120). Statistical significances were inferred by the Student's t test; ***P < 0.001, **P < 0.01, *P < 0.05, .P < 0.1. Strain labels are as in Figure 4.