
Figure 6.
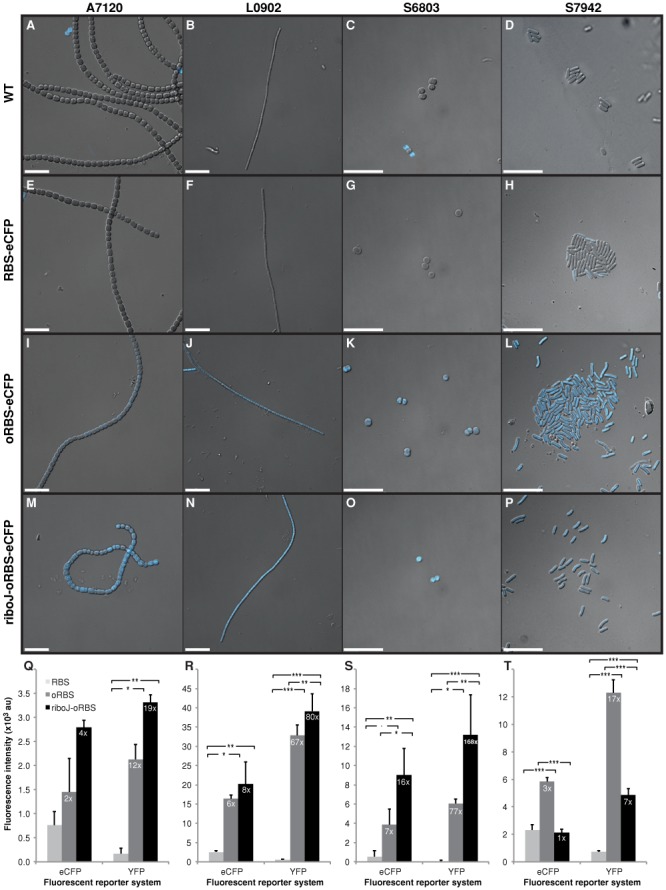
Levels of eCFP fluorescence produced by different ribosome-binding sites and a ribozyme-based insulator sequence in four cyanobacterial strains. (A)–(P) Photomicrographs of WT strains and strains harboring eCFP driven by PconII and a synthetic RBS, an optimized synthetic RBS (oRBS), or a RiboJ sequence upstream of the oRBS. Images are merged differential interference contrast (DIC) and cyan fluorescence photomicrographs. In the photomicrographs A and C, blue fluorescing cells represent dying WT cells that have lost autofluorescence. (Q)–(T) Mean eCFP and YFP fluorescence intensities ± SD of triplicate cultures grown from three independent colonies normalized to OD750 of 0.2 (0.1 for A7120). Fold changes of fluorescence intensities for the oRBS and the RiboJ-oRBS over the original synthetic RBS are shown. Statistical significances were inferred by the Tukey's test (HSD); ***P < 0.001, **P < 0.01, *P < 0.05, .P < 0.1. Strain labels are as in Figure 4.