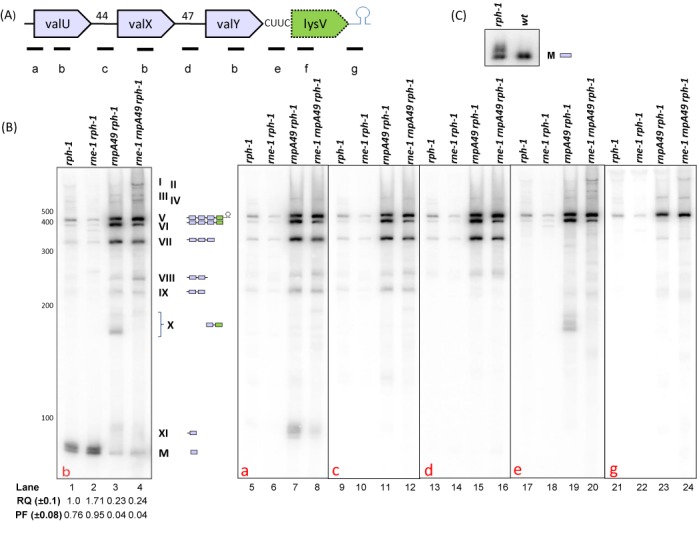
Figure 1.

Analysis of valU operon processing. (A) Schematic diagram of the valU operon (not drawn to scale). Relative positions of the oligonucleotide probes (a: valU-UP, b: valUXYTZ, c: valU-X, d: valX-Y, e: valY-lysV, f: lysmature, g:lysV-TER) used in Northern analyses are shown. Probe sequences are listed in Supplementary Table S1 (Supplementary Materials). Numbers indicate the length of the intergenic spacers. (B) Northern analysis of valU operon. The specific oligonucleotide probe used for each blot is indicated in the bottom left corner of each blot. The genotypes of the strains used are listed on the top of each autoradiogram. The RNA molecular size standards (nucleotides) (Fermentas) are shown to the left of the first image. The numerical designations of the different species along with their graphical structures are shown to the right of the first blot. Relative quantity (RQ) of mature tRNAVal (M) in various genetic backgrounds was calculated by setting a level of one in the rph-1 strain. Processed fraction (PF) represents the fraction of mature tRNA relative to the total amount of processed and unprocessed species of that tRNA. Each value represents the average of at least three independent determinations. (C) Analysis of the role of RNase PH in the final maturation of the five valine type I tRNAs.
