
Figure 1.
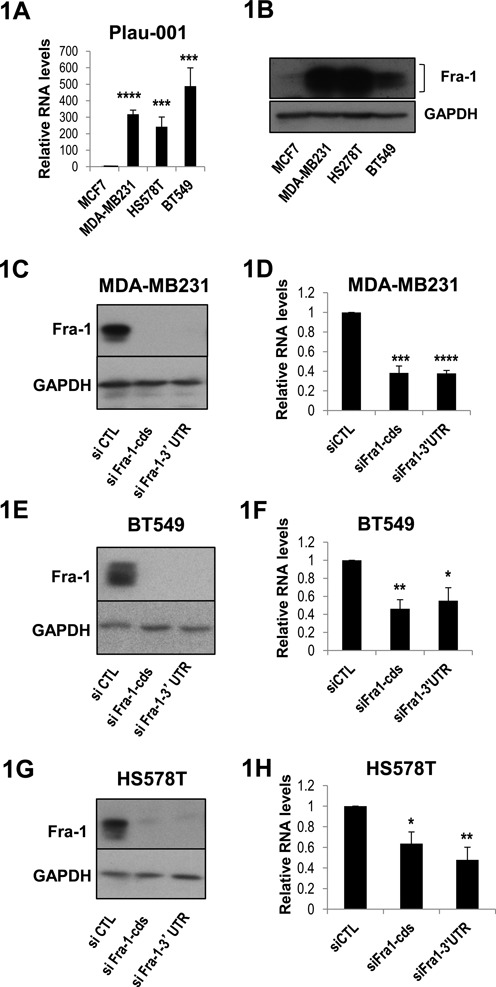
Control of uPA mRNA abundance by Fra-1 in ER− breast cancer cell lines. (A) Relative abundances of Plau-001 mRNA in MCF-7, MDA-MB231, BT549, HS578T cells. mRNA abundances were assayed by RT-qPCR from total cellular RNA and normalized to S26 mRNA taken as an internal standard. The Plau-001/S26 mRNA ratio was arbitrarily set to 1 in MCF-7 cells. (B) Fra-1 protein levels in MCF-7, MDA-MB231, BT549 and HS578T cells. Fra-1 protein levels were compared by immunoblotting using a specific Fra-1 antiserum. Fra-1 is indicated by brackets. Glyceraldehyde-3-phosphate dehydrogenase (GAPDH) was taken as an electrophoresis loading control. (C, E, G) RNAi-mediated depletion of Fra-1 protein in MDA-MB231 (C), BT549 (E) and HS578T cells (G). Cells were transfected with either a control siRNA (siCTL) or siRNAs directed against the Fra-1 coding sequence (siFra-1-cds) or the 3′ unstranslated region (siFra-1–3′UTR) and protein contents were analyzed by immunoblotting with the relevant antibodies 48 h later. (D, F, H) Plau-001 mRNA reduction in siRNA-transfected MDA-MB231- (D), BT549- (F) and HS578T cells (H). Plau-001 mRNA was assayed by RT-qPCR 48 h post-siRNA transfection in the same cells as in C, E and F. Plau-001 mRNA abundance was arbitrarily set to 1 in siCTL-transfected cells for calculation of mean values. In A, D, F and H, values are the means of four independent experiments and error bars indicate standard deviations. Results of the Student's paired t-test are indicated on the graphs.