
Figure 2.
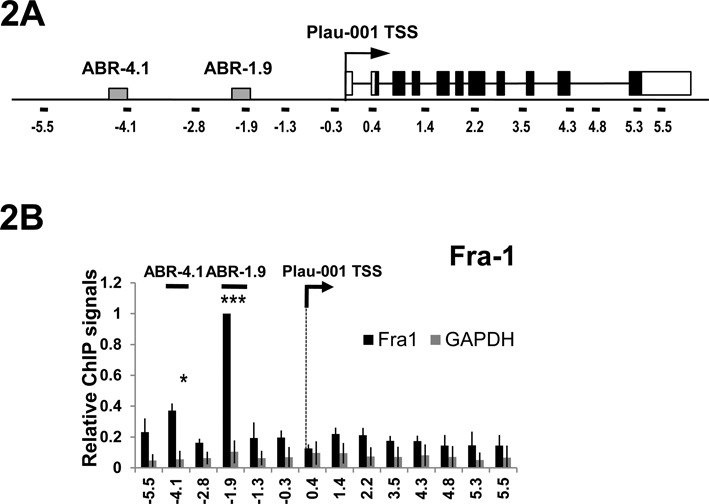
Binding of Fra-1 to the Plau locus. (A) Structure of the Plau locus. White boxes indicate Plau-001 5′UTR and 3′UTR, whereas black boxes indicate the uPA open reading frame. The arrow refers to Plau-001 TSS, as indicated in the Ensembl database. ABR-1.9 and ABR-4.1 (gray boxes) indicate Fra-1-binding regions (see text). Black lines indicate the DNA fragments (100–200 bp each) amplified by qPCR in ChIP analyses, the numbers indicating the position of their middle with respect to the TSS. (B) Fra-1 ChIP analyses. ChIP were conducted using either Fra-1-specific antibodies (black) or an anti-GAPDH antibody used as negative control (grey). Values are the means of three independent experiments and are normalized to amplicon −1.9 (containing ABR-1.9), which was arbitrarily set to 1. Primer sequences are given in Supplementary Information S1.